Copyright
©2012 Baishideng Publishing Group Co.
World J Radiol. Oct 28, 2012; 4(10): 421-430
Published online Oct 28, 2012. doi: 10.4329/wjr.v4.i10.421
Published online Oct 28, 2012. doi: 10.4329/wjr.v4.i10.421
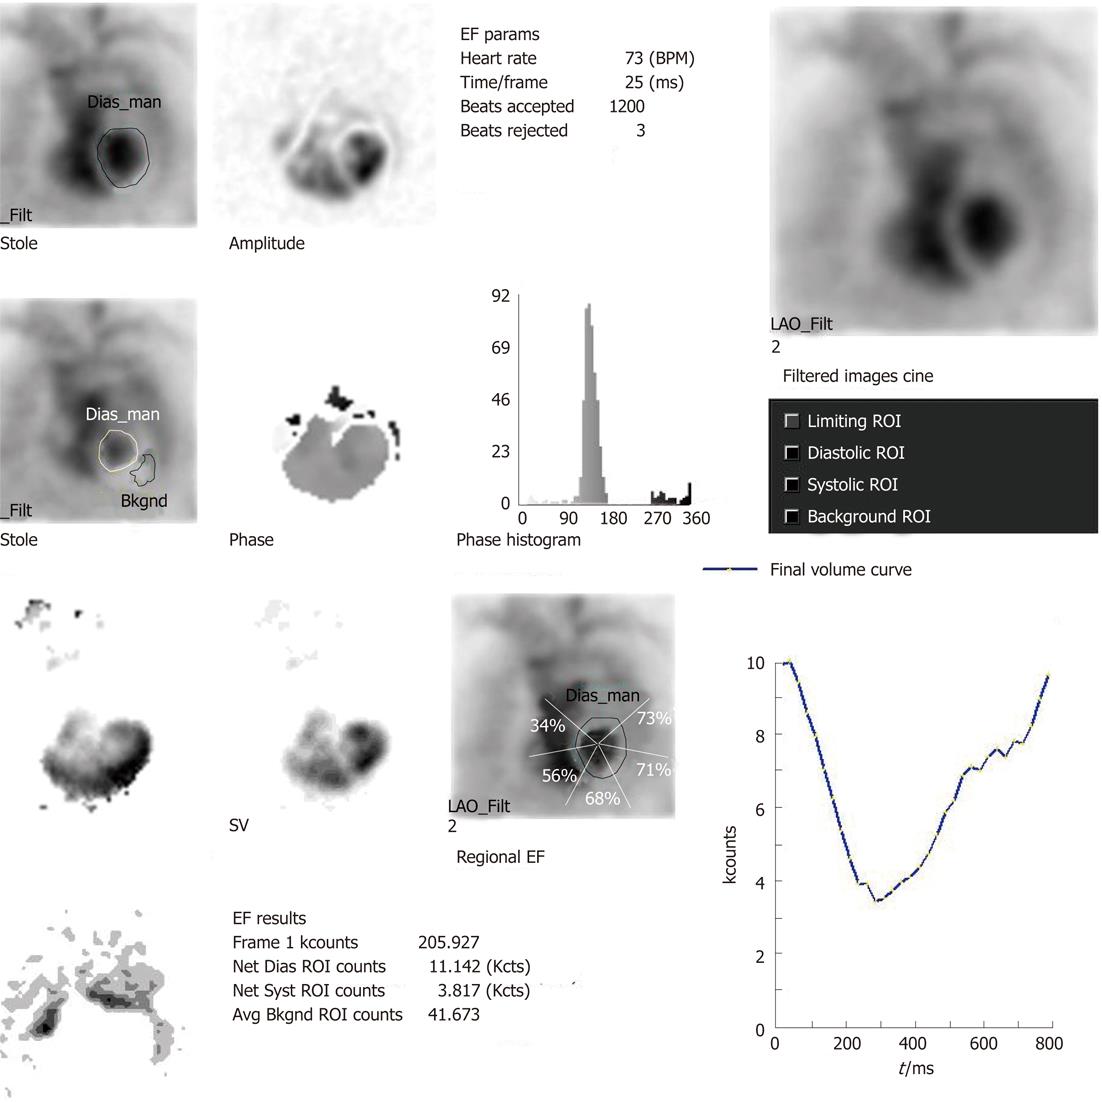
Figure 1 Normal multigated acquisition study with left ventricular ejection fraction of 66%.
The phase image shows synchronous contraction across the left ventricular (LV) myocardium with narrow phase histogram width. The left and right ventricular phases are in sync with each other and out of sync with the atrial phase. The amplitude image shows maximal count variation in the lateral wall of LV myocardium suggesting maximal contraction by lateral wall and paradox image does not show any wall of LV myocardium to be in paradox. LV time activity curve is normal. EF: Ejection fraction; ROI: Region of interest; LAO: Left anterior oblique; SV: Stroke volume; Syst: Systolic; Dias: Diastolic; Avg Bkgnd: Average backgroud.
- Citation: Mitra D, Basu S. Equilibrium radionuclide angiocardiography: Its usefulness in current practice and potential future applications. World J Radiol 2012; 4(10): 421-430
- URL: https://www.wjgnet.com/1949-8470/full/v4/i10/421.htm
- DOI: https://dx.doi.org/10.4329/wjr.v4.i10.421


