Copyright
©2011 Baishideng Publishing Group Co.
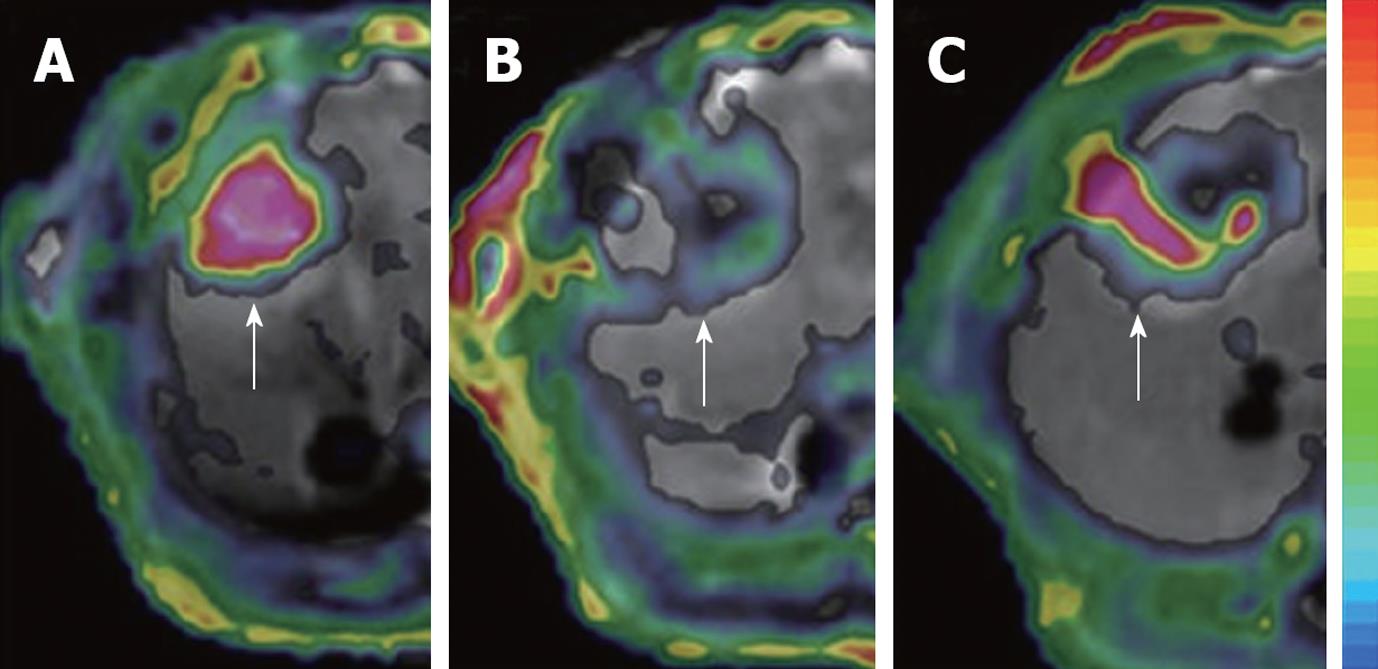
Figure 4 Dynamic changes in Ktrans.
The tumor (arrows) in rat liver showed an abundant blood supply with high Ktrans before treatment (A); At 6 h after CA4P treatment, vascular shutdown was indicated with low Ktrans in the center, surrounded by tumor residue at the periphery, with moderate Ktrans (B); At 48 h after treatment, the tumor relapsed upon the residue at the periphery with rebounding Ktrans (C).
- Citation: Wang H, Marchal G, Ni Y. Multiparametric MRI biomarkers for measuring vascular disrupting effect on cancer. World J Radiol 2011; 3(1): 1-16
- URL: https://www.wjgnet.com/1949-8470/full/v3/i1/1.htm
- DOI: https://dx.doi.org/10.4329/wjr.v3.i1.1


