Copyright
©2010 Baishideng Publishing Group Co.
World J Radiol. May 28, 2010; 2(5): 159-165
Published online May 28, 2010. doi: 10.4329/wjr.v2.i5.159
Published online May 28, 2010. doi: 10.4329/wjr.v2.i5.159
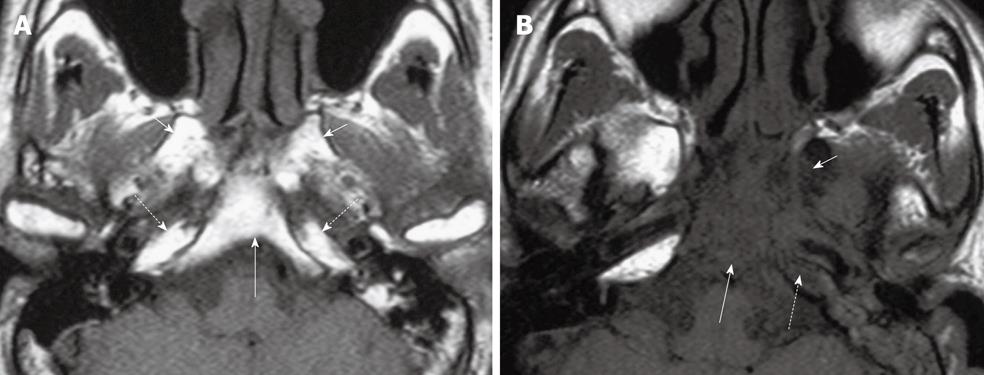
Figure 6 Axial T1 weighted MRI of the skull base showing five key bony sites to check for tumor invasion.
A: Normal skull base showing T1W weighted signal of normal fatty bone marrow within the clivus (long arrow), bilateral pterygoid bases (short arrows) and petrous apices (broken arrows); B: Abnormal skull base showing loss of normal high T1 weighted signal due to tumor invasion of the clivus (long arrow), left pterygoid base (short arrow) and left petrous apex (broken arrow).
- Citation: King AD, Bhatia KSS. Magnetic resonance imaging staging of nasopharyngeal carcinoma in the head and neck. World J Radiol 2010; 2(5): 159-165
- URL: https://www.wjgnet.com/1949-8470/full/v2/i5/159.htm
- DOI: https://dx.doi.org/10.4329/wjr.v2.i5.159


