Copyright
©2010 Baishideng Publishing Group Co.
World J Radiol. Oct 28, 2010; 2(10): 384-398
Published online Oct 28, 2010. doi: 10.4329/wjr.v2.i10.384
Published online Oct 28, 2010. doi: 10.4329/wjr.v2.i10.384
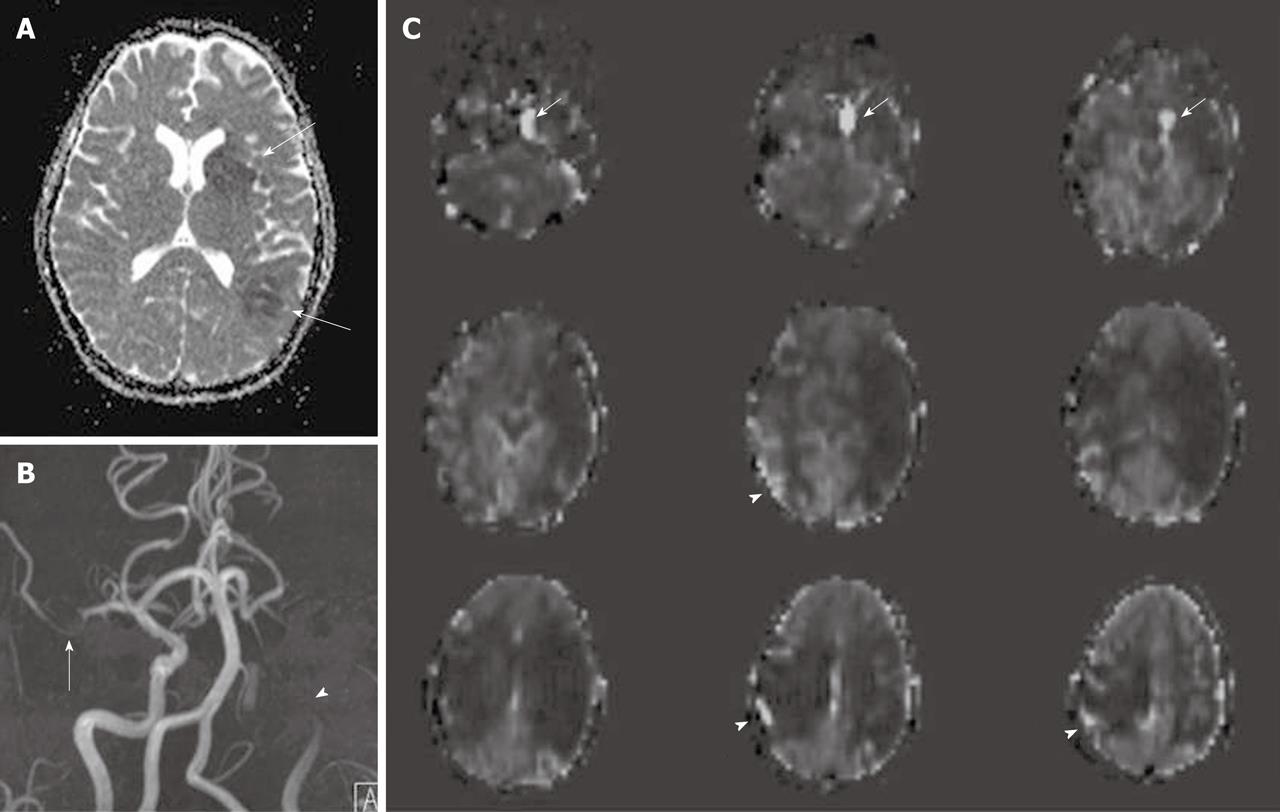
Figure 4 Acute cerebral infarction of left middle cerebral artery territory seen as two foci of low signal intensity on ADC map (A) (white arrows).
Magnetic resonance angiography (B) demonstrates left internal carotid artery (ICA) occlusion (white arrowhead) and right middle cerebral artery (MCA) stenosis (white arrow). Arterial spin labeling cerebral blood flow maps (C) reveal a large area of perfusion diffusion mismatch in the left cerebral hemisphere and also hypoperfusion in the right MCA territory. Delayed arterial transit effects are also seen over the hypoperfusion area in the right cerebral hemisphere (white arrowheads) as well as intravascular signal in the left ICA proximal to the occluded site (white arrows).
- Citation: Petcharunpaisan S, Ramalho J, Castillo M. Arterial spin labeling in neuroimaging. World J Radiol 2010; 2(10): 384-398
- URL: https://www.wjgnet.com/1949-8470/full/v2/i10/384.htm
- DOI: https://dx.doi.org/10.4329/wjr.v2.i10.384


