Copyright
©2010 Baishideng Publishing Group Co.
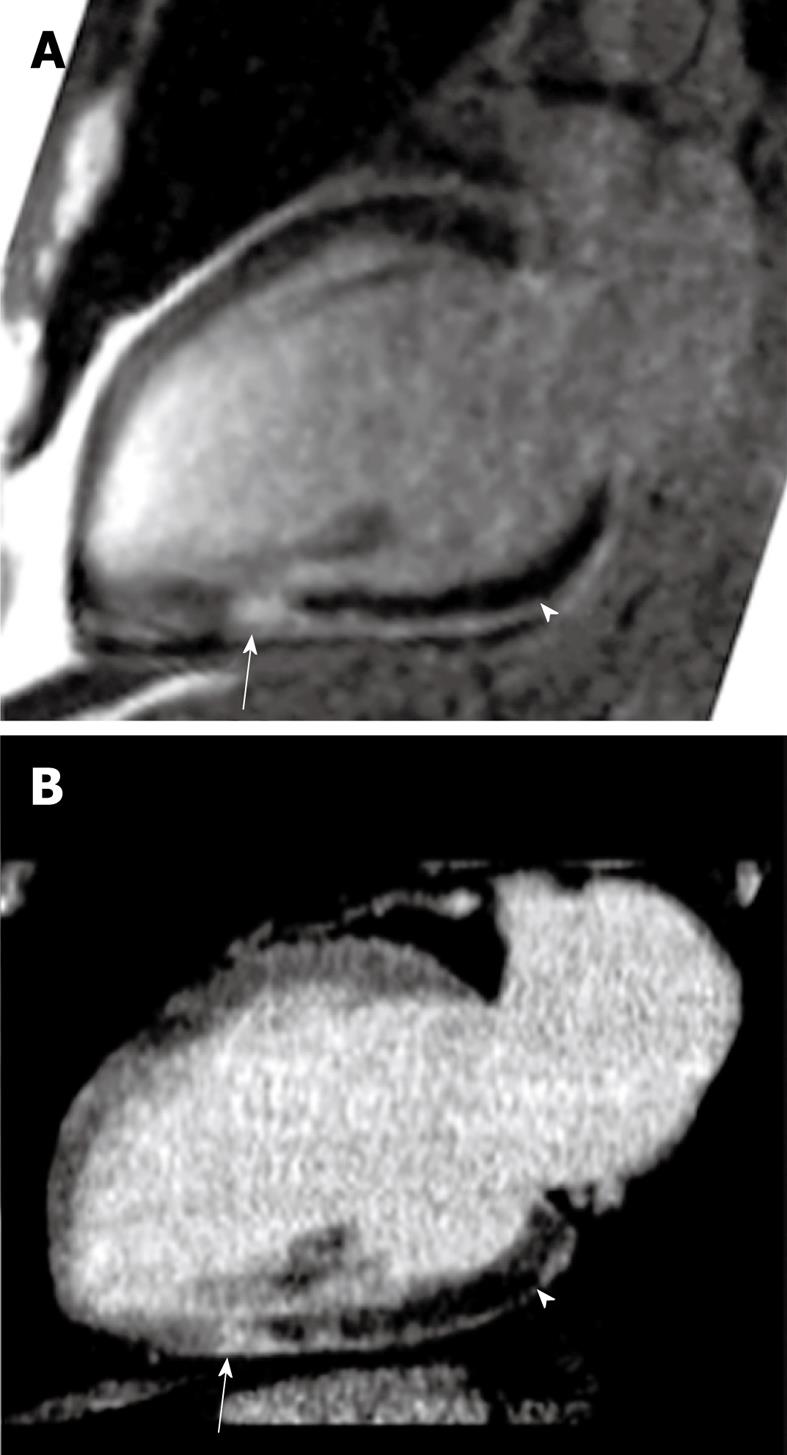
Figure 6 Head-to-head comparison of DE-MR (A) and DE-MDCT images (B) showing the dark MO zone (arrowheads) surrounded by a bright enhanced infarct in a reperfused patient (arrows)[38].
- Citation: Saeed M, Hetts S, Wilson M. Reperfusion injury components and manifestations determined by cardiovascular MR and MDCT imaging. World J Radiol 2010; 2(1): 1-14
- URL: https://www.wjgnet.com/1949-8470/full/v2/i1/1.htm
- DOI: https://dx.doi.org/10.4329/wjr.v2.i1.1


