
















Copyright: ©Author(s) 2026.
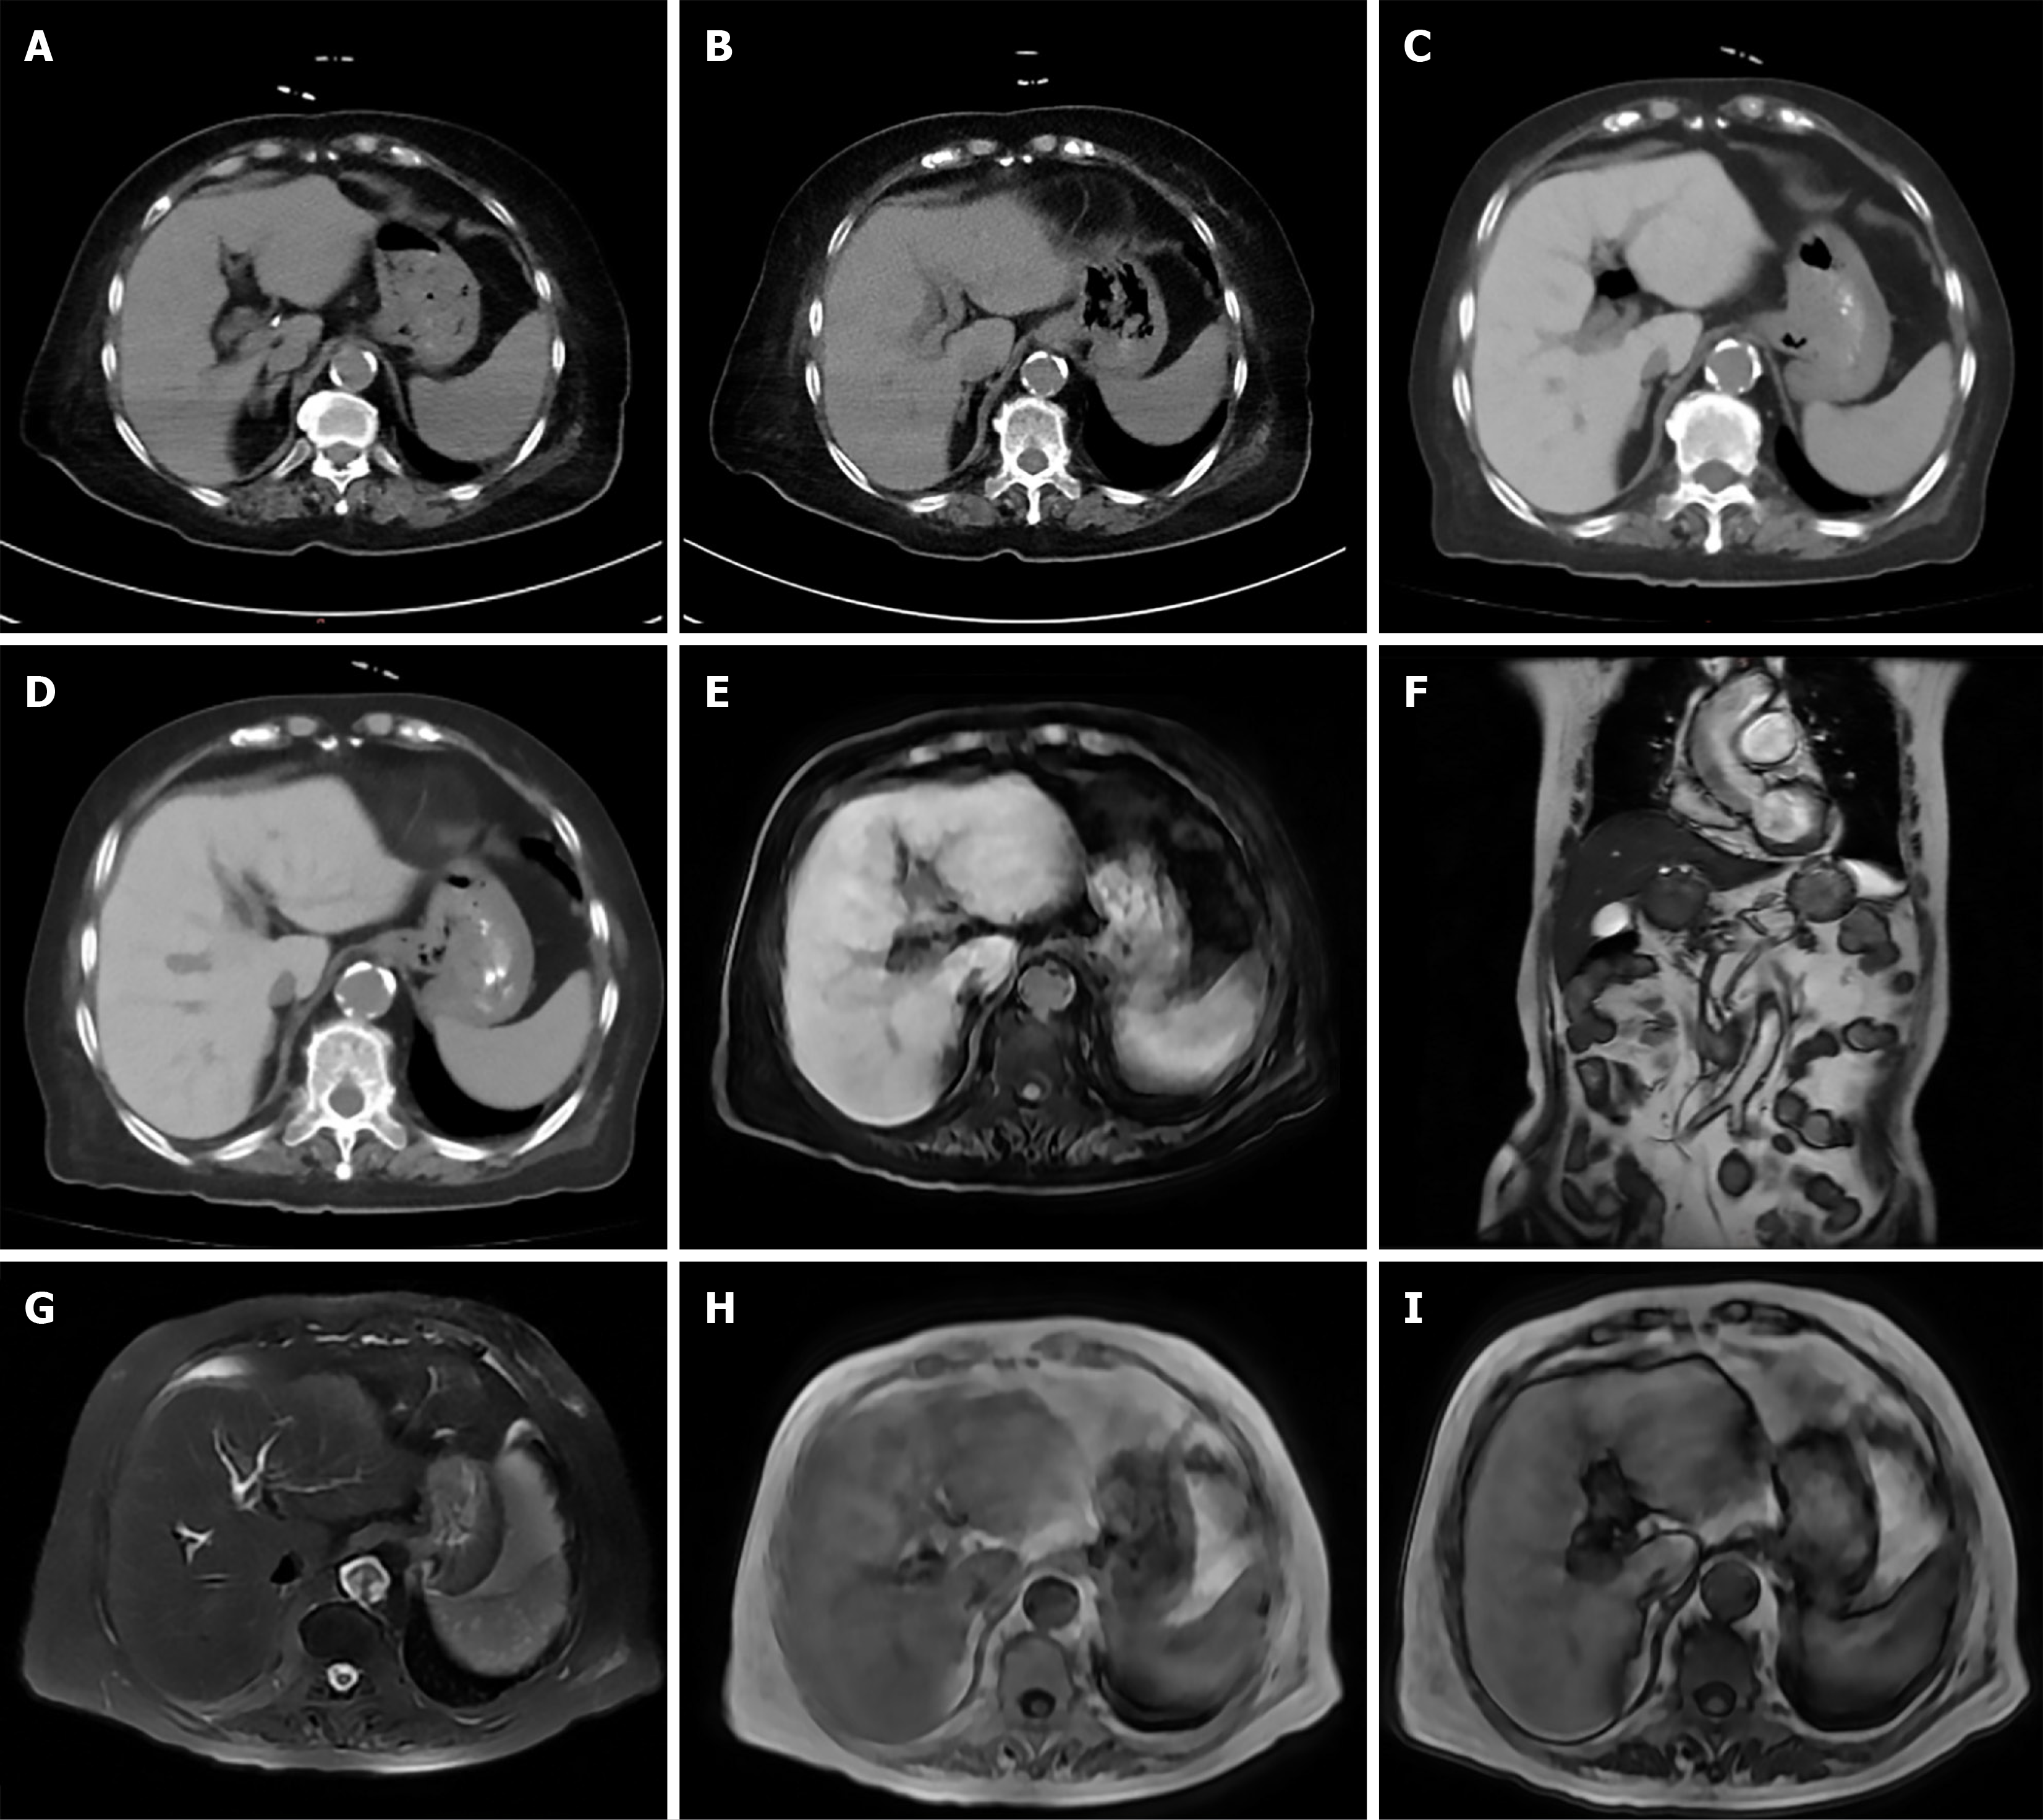
Figure 2 Serial liver imaging before and after amiodarone therapy.
A and B: Chest computed tomography (CT) performed before initiation of amiodarone therapy (January 16, 2025) demonstrates homogeneous hepatic attenuation [approximately 52 Hounsfield units (HU)], comparable to that of the spleen; C and D: Chest CT obtained after amiodarone therapy (June 3, 2025) reveals a marked increase in hepatic attenuation (approximately 120 HU), substantially exceeding splenic attenuation. The liver is normal in size and contour, with smooth margins and no focal lesions; E-I: Abdominal magnetic resonance imaging performed after amiodarone therapy (June 5, 2025) demonstrates isointense hepatic parenchymal signal on T1-weighted imaging and mildly hypointense signal on T2-weighted imaging. No appreciable signal loss is observed on in-phase or out-of-phase sequences.
- Citation: Shen ZQ, Xia XX, Dong DW, Zhang XF, Shi NJ. Amiodarone-induced liver injury with bright liver sign: A case report. World J Radiol 2026; 18(9): 125365
- URL: https://www.wjgnet.com/1949-8470/full/v18/i9/125365.htm
- DOI: https://dx.doi.org/10.4329/wjr.125365