
















Copyright: ©Author(s) 2026.
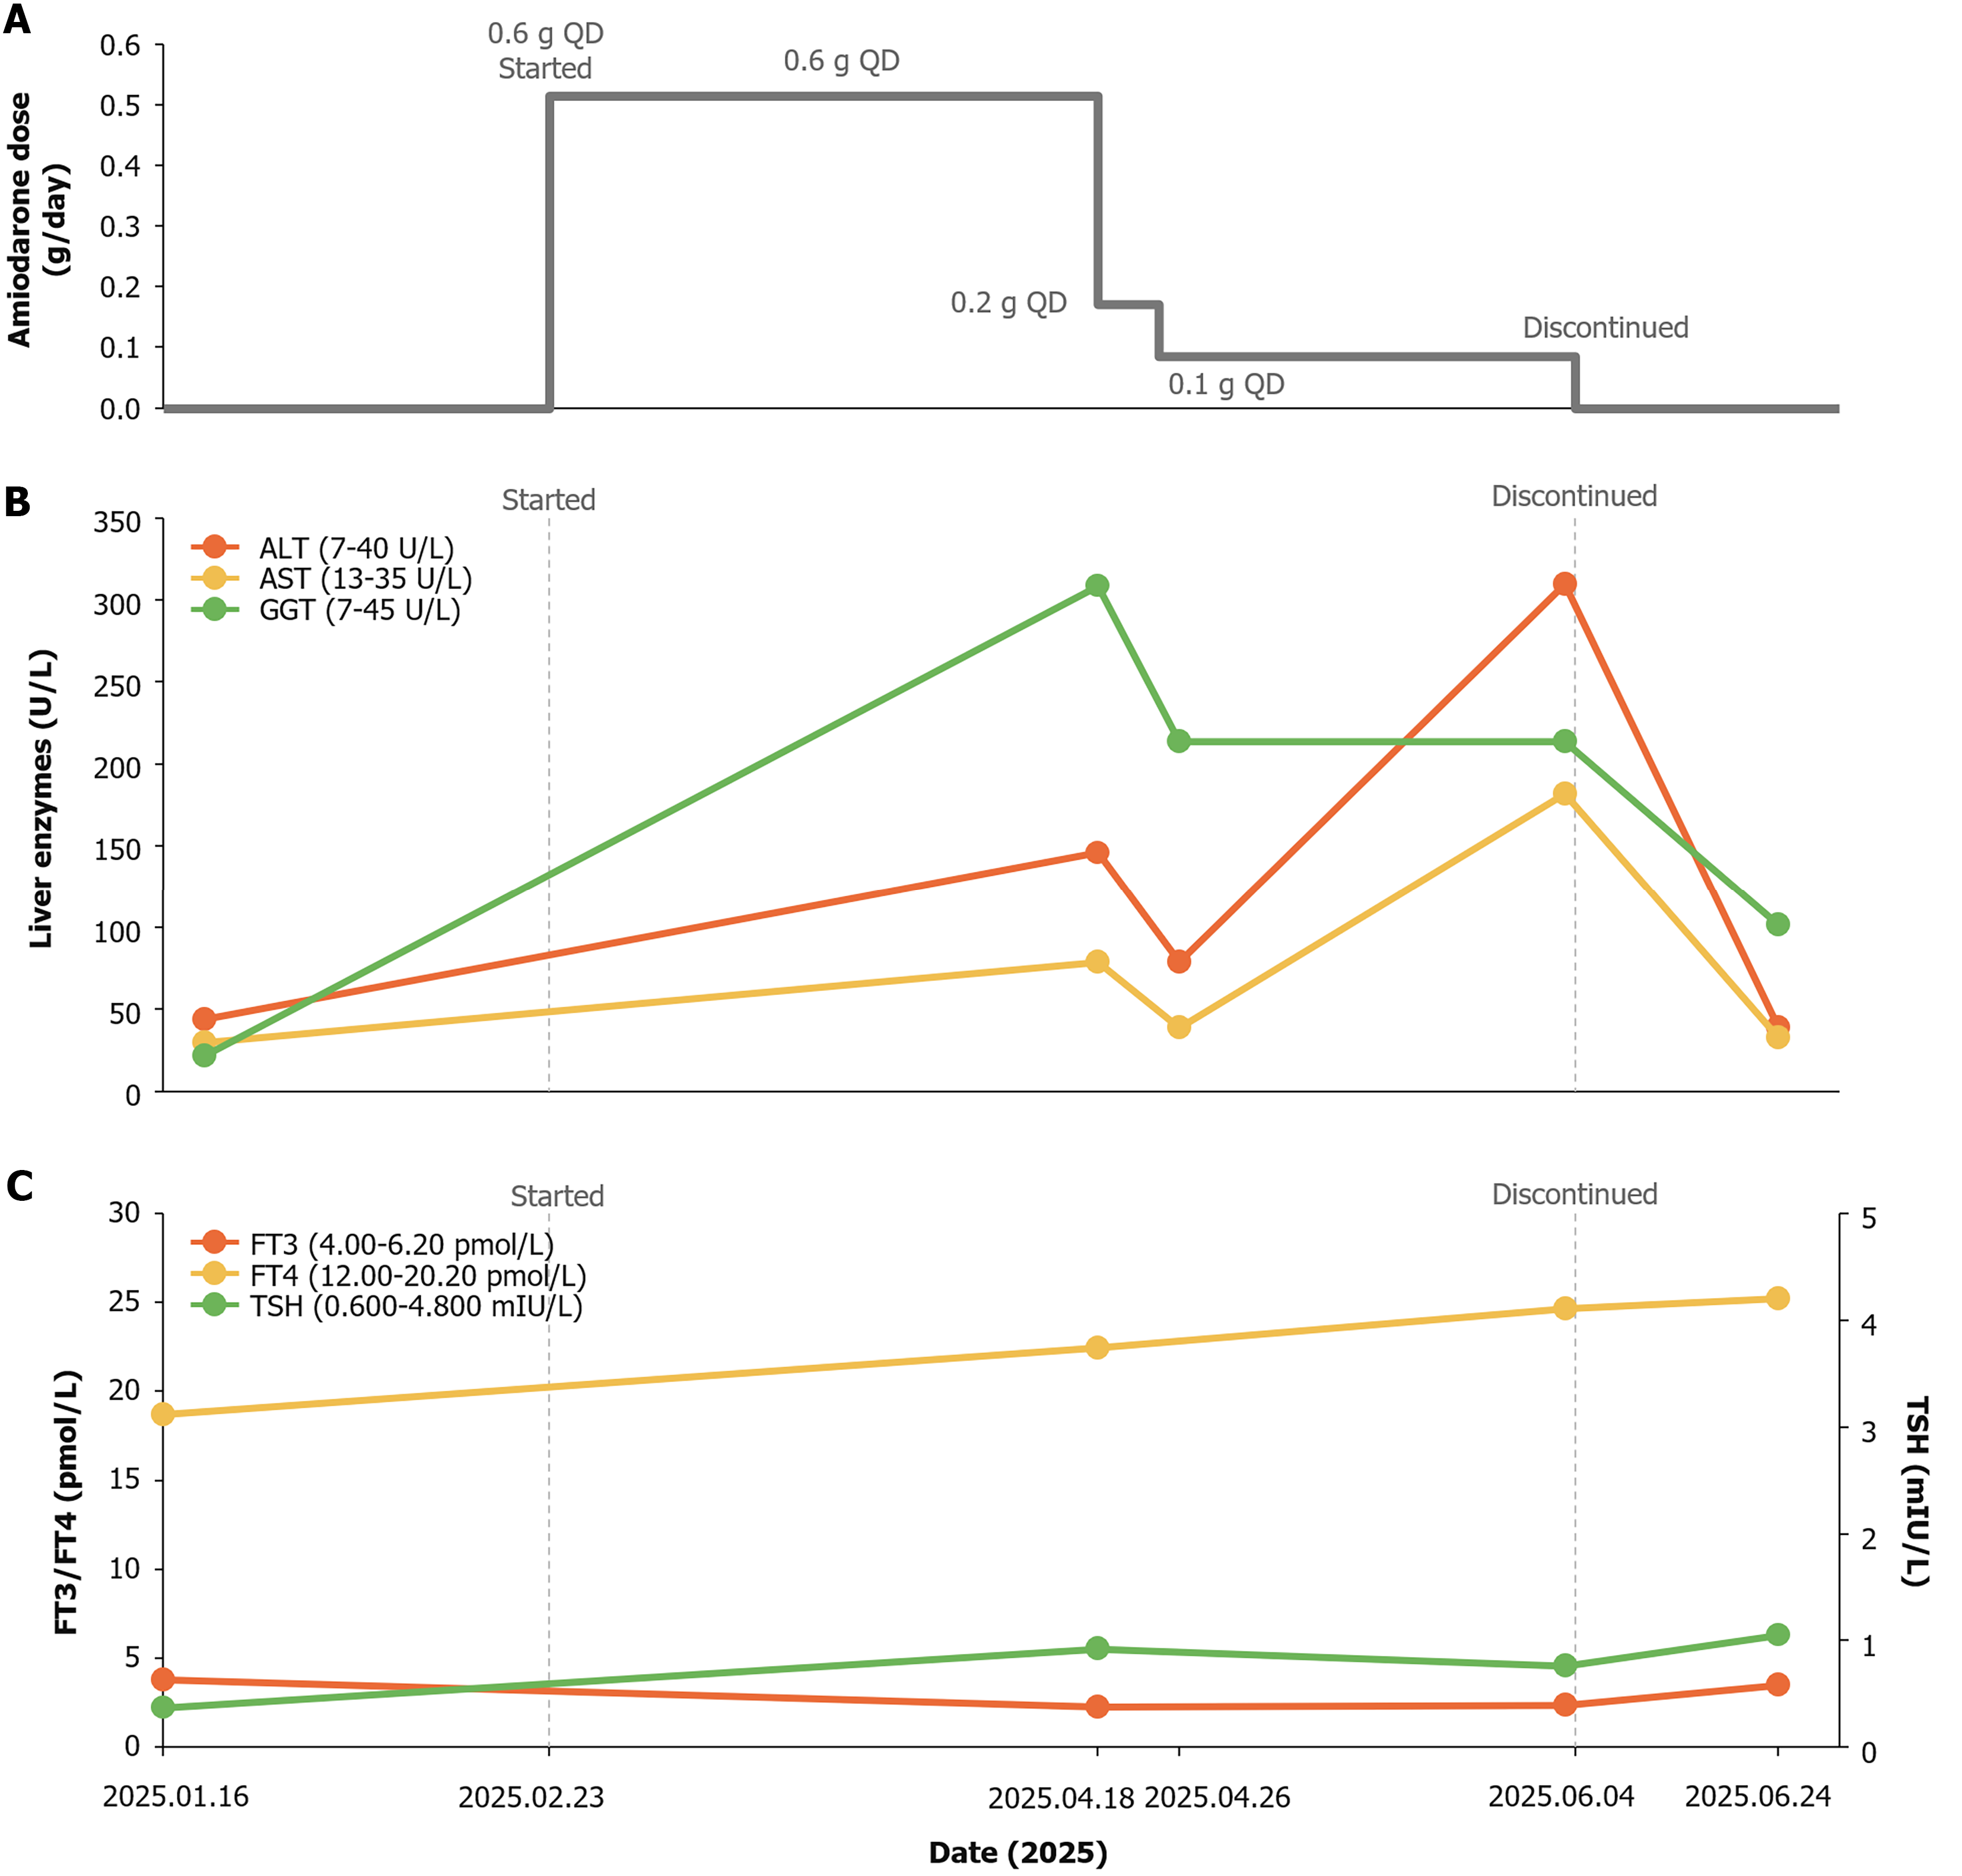
Figure 1 Changes in liver and thyroid function before and after amiodarone administration.
A: Amiodarone dosing timeline; B: Dynamic changes in liver function tests during amiodarone therapy. The line graph illustrates serial trends in serum alanine aminotransferase, aspartate aminotransferase, and gamma-glutamyl transferase levels throughout the clinical course. Liver enzyme levels increased substantially during prolonged amiodarone therapy and gradually declined following amiodarone discontinuation and initiation of hepatoprotective treatment; C: Dynamic changes in thyroid function tests during amiodarone therapy. The line graph illustrates serial trends in serum free triiodothyronine (FT3), free thyroxine (FT4), and thyroid-stimulating hormone (TSH) levels during amiodarone treatment. During therapy, FT4 levels progressively increased, whereas FT3 levels decreased. TSH was not appropriately suppressed despite elevated FT4 levels. These thyroid function abnormalities persisted after discontinuation of amiodarone. ALT: Alanine aminotransferase; AST: Aspartate aminotransferase; GGT: Gamma-glutamyl transferase; FT3: Free triiodothyronine; FT4: Free thyroxine; TSH: Thyroid stimulating hormone; QD: Daily.
- Citation: Shen ZQ, Xia XX, Dong DW, Zhang XF, Shi NJ. Amiodarone-induced liver injury with bright liver sign: A case report. World J Radiol 2026; 18(9): 125365
- URL: https://www.wjgnet.com/1949-8470/full/v18/i9/125365.htm
- DOI: https://dx.doi.org/10.4329/wjr.125365