
















Copyright: ©Author(s) 2026.
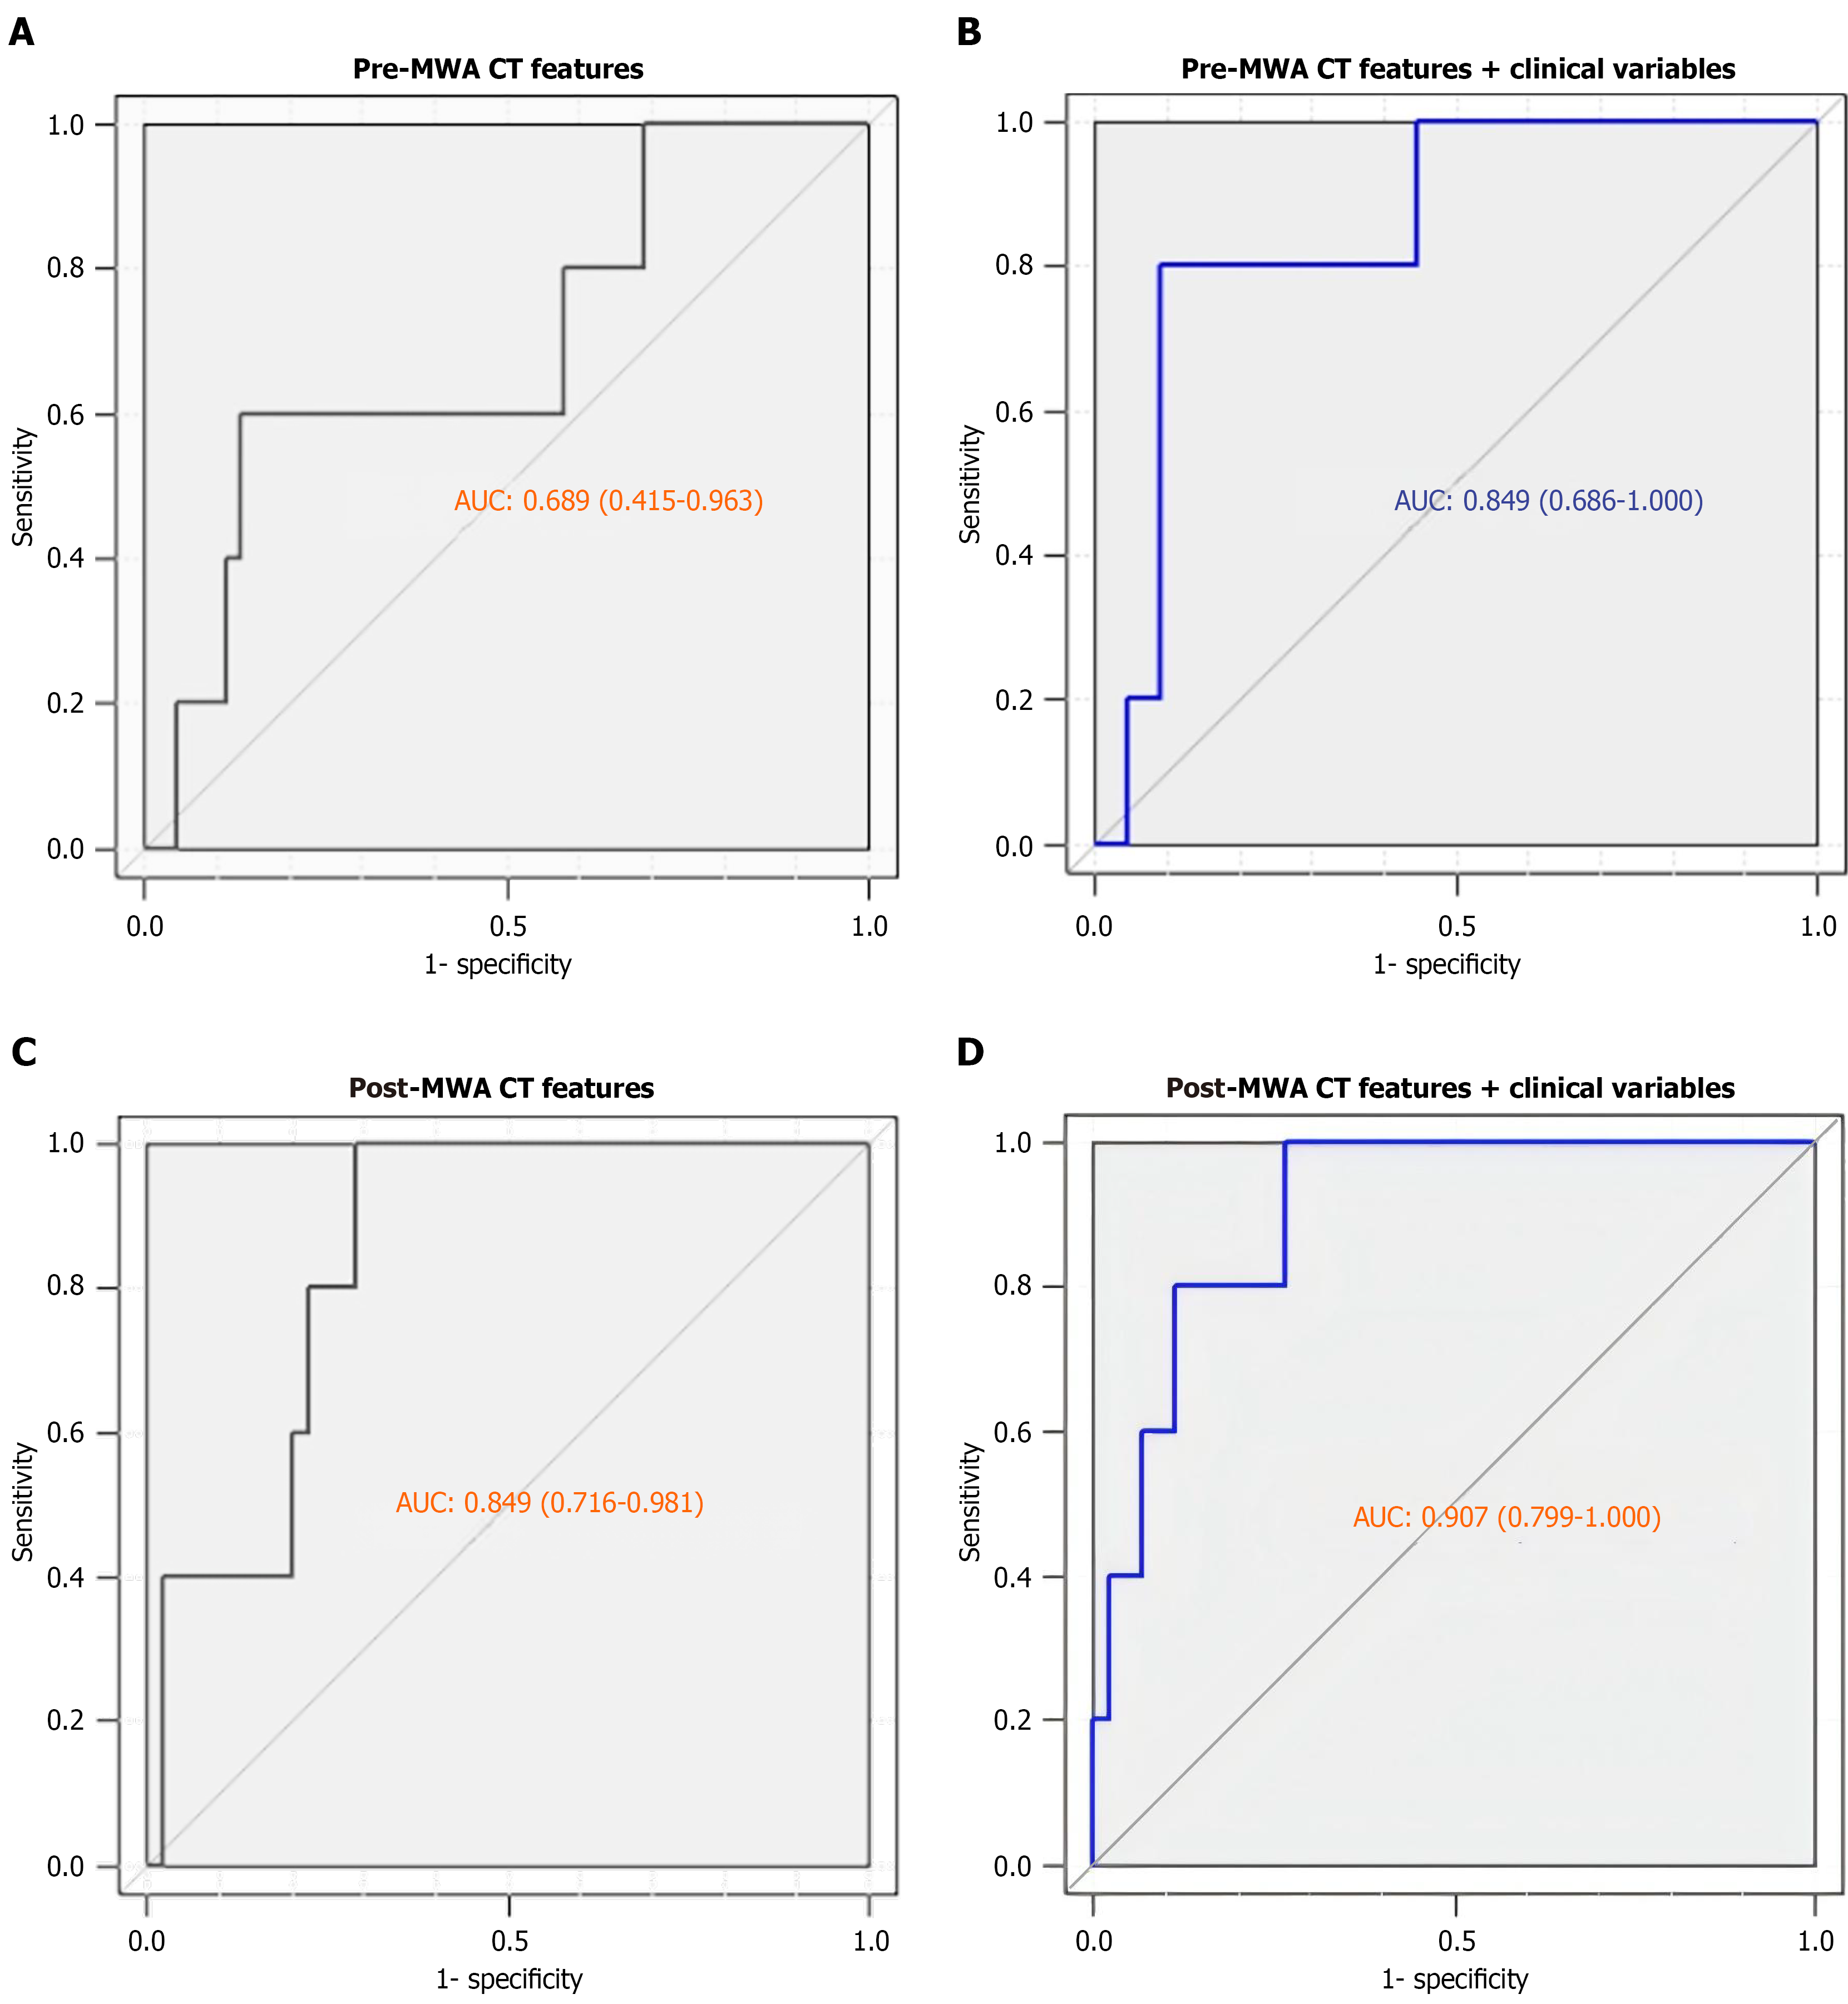
Figure 3 Receiver operating characteristic curves for predicting 6-month local tumor progression using four different prediction models.
A: The receiver operating characteristic (ROC) curves of prediction models of 6-month local tumor progression (LTP) based on pre-microwave ablation (MWA) computed tomography (CT) features. The ROC curves were used to evaluate the models, and the areas under the curve area under the ROC curve (AUC) was 0.689; B: The ROC curves of prediction models of 6-month LTP based on pre-MWA CT features and simple clinical characteristics. The ROC curves were used to evaluate the models, and the areas under the curve AUC was 0.849; C: The ROC curves of prediction models of 6-month LTP based on post-MWA CT features. The ROC curves were used to evaluate the models, and the areas under the curve AUC was 0.849; D: The ROC curves of prediction models of 6-month LTP based on post-MWA CT features and clinical variables. The ROC curves were used to evaluate the models, and the areas under the curve AUC was 0.907. MWA: Microwave ablation; CT: Computed tomography; AUC: Areas under the curve area under the receiver operating characteristic curve.
- Citation: Qin QJ, Hou MY, Tian JJ, Sun YZ, Jing XH, Zuo TY. Immediate post-microwave ablation computed tomography model may better predict short-term response of stage I non-small cell lung cancer. World J Radiol 2026; 18(9): 124658
- URL: https://www.wjgnet.com/1949-8470/full/v18/i9/124658.htm
- DOI: https://dx.doi.org/10.4329/wjr.124658