
















Copyright: ©Author(s) 2026.
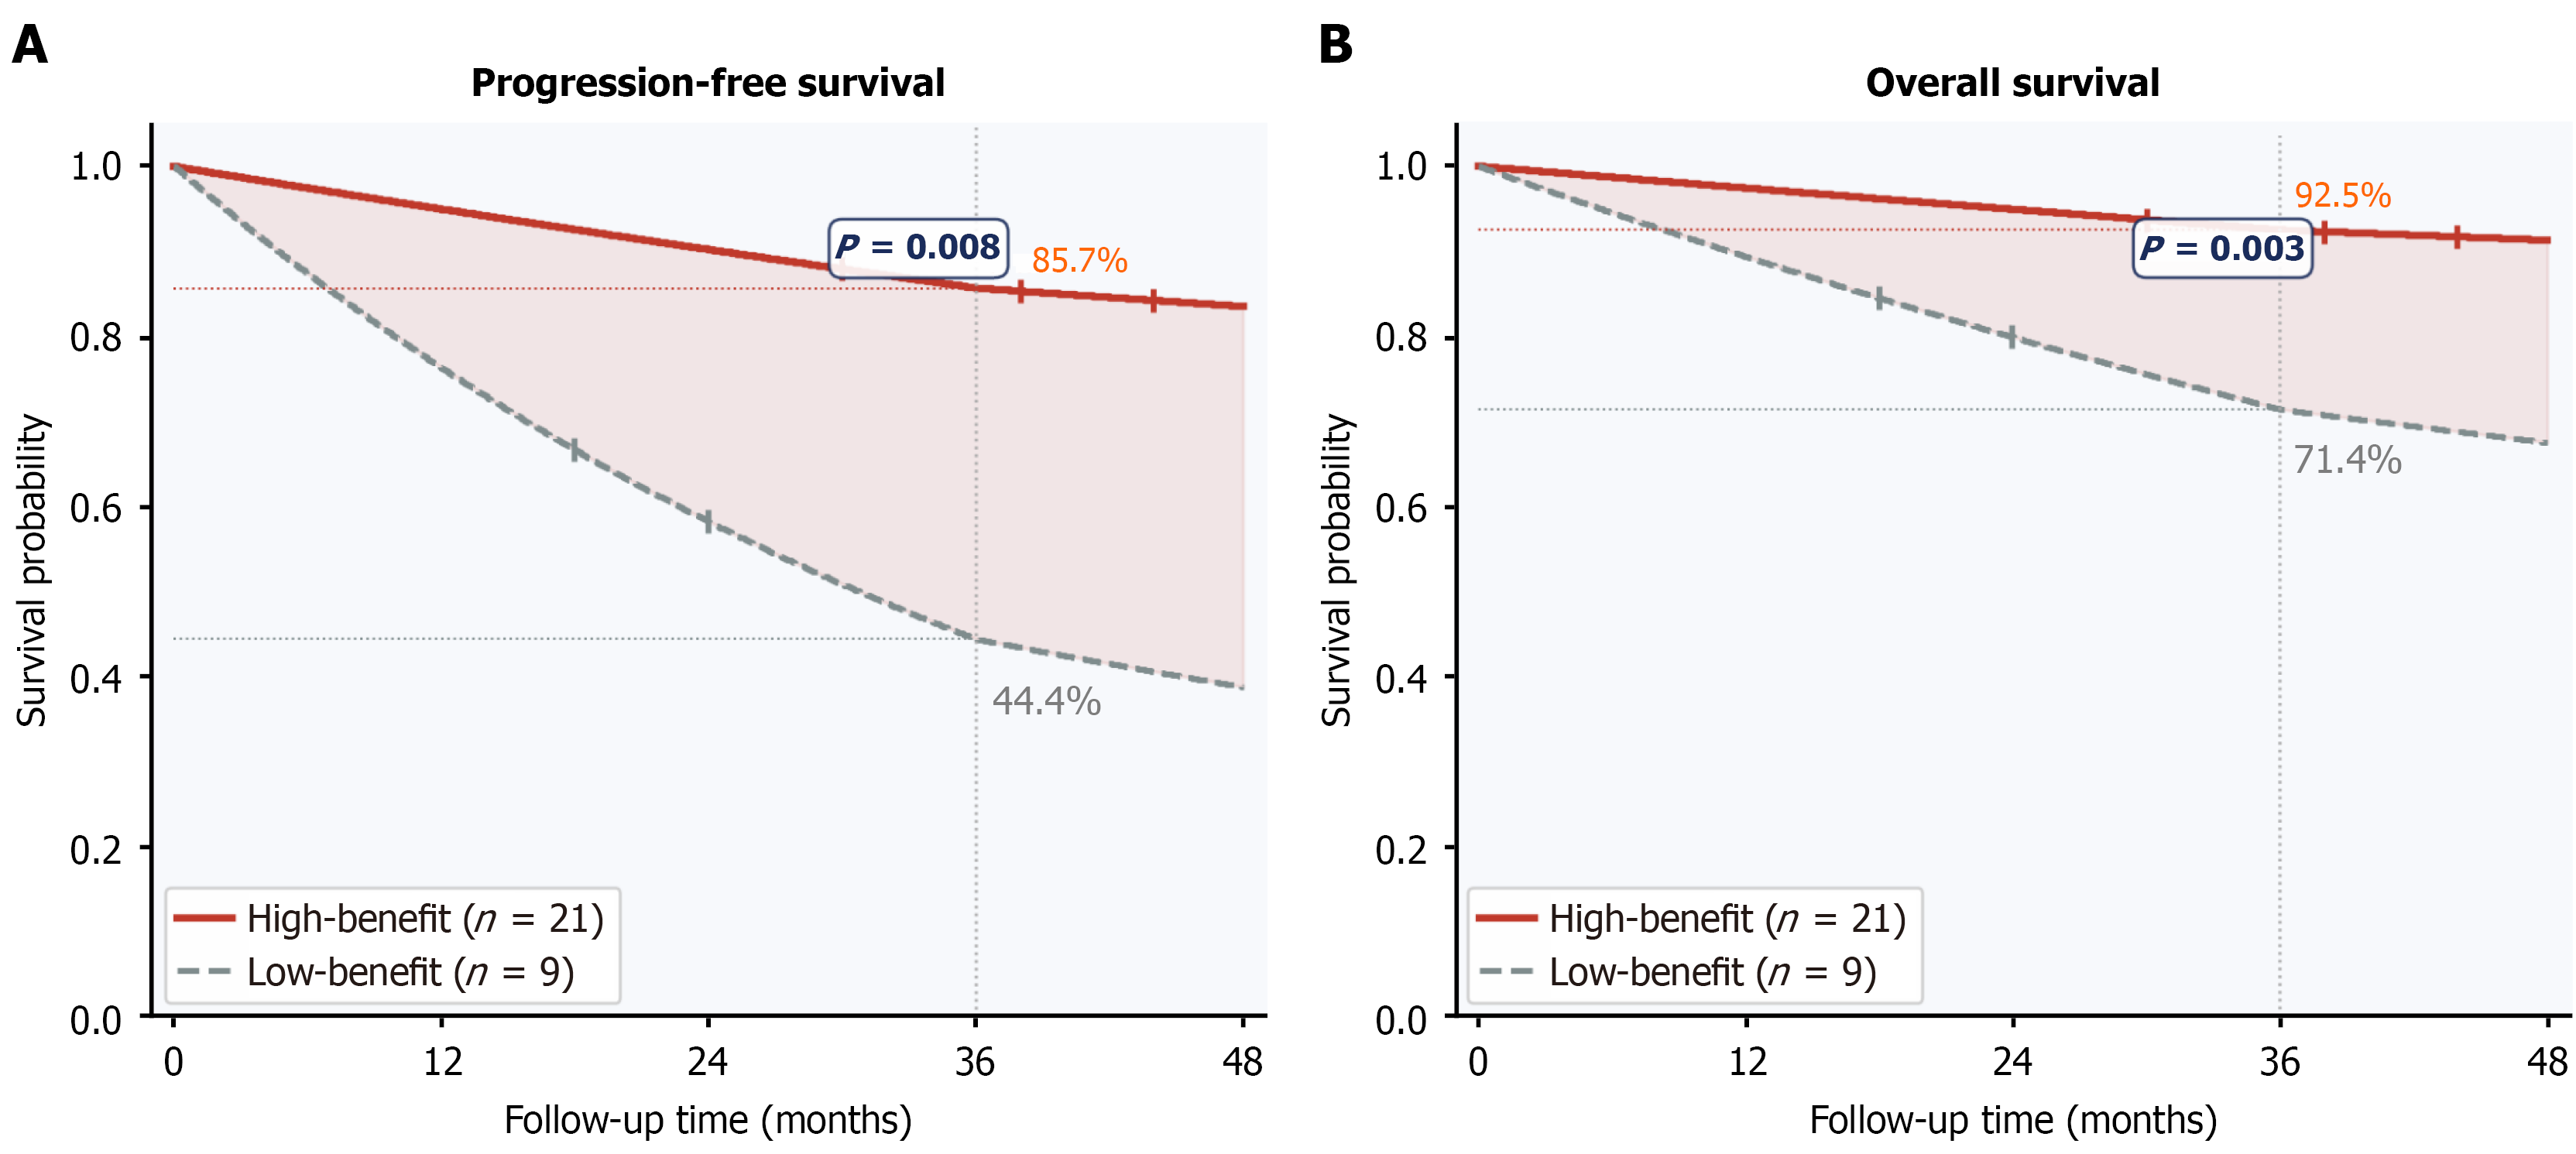
Figure 2 Kaplan-Meier survival curves for different fusion model prediction groups.
High benefit group (n = 21, red line) vs low benefit group (n = 9, gray dashed line). A: Progression-free survival (PFS): 3-year PFS 85.7% vs 44.4% (P = 0.008); B: Overall survival (OS): 3-year OS 92.5% vs 71.4% (P = 0.003).
- Citation: Wang SP, Chen ZG, Shan XJ, Jin M, Zhao W, Tong X, Meng X. Development and validation of a multimodal MRI habitat-based deep learning fusion model for predicting 252Cf neutron therapy response in cervical cancer. World J Radiol 2026; 18(9): 123597
- URL: https://www.wjgnet.com/1949-8470/full/v18/i9/123597.htm
- DOI: https://dx.doi.org/10.4329/wjr.123597