















Copyright: ©Author(s) 2026.
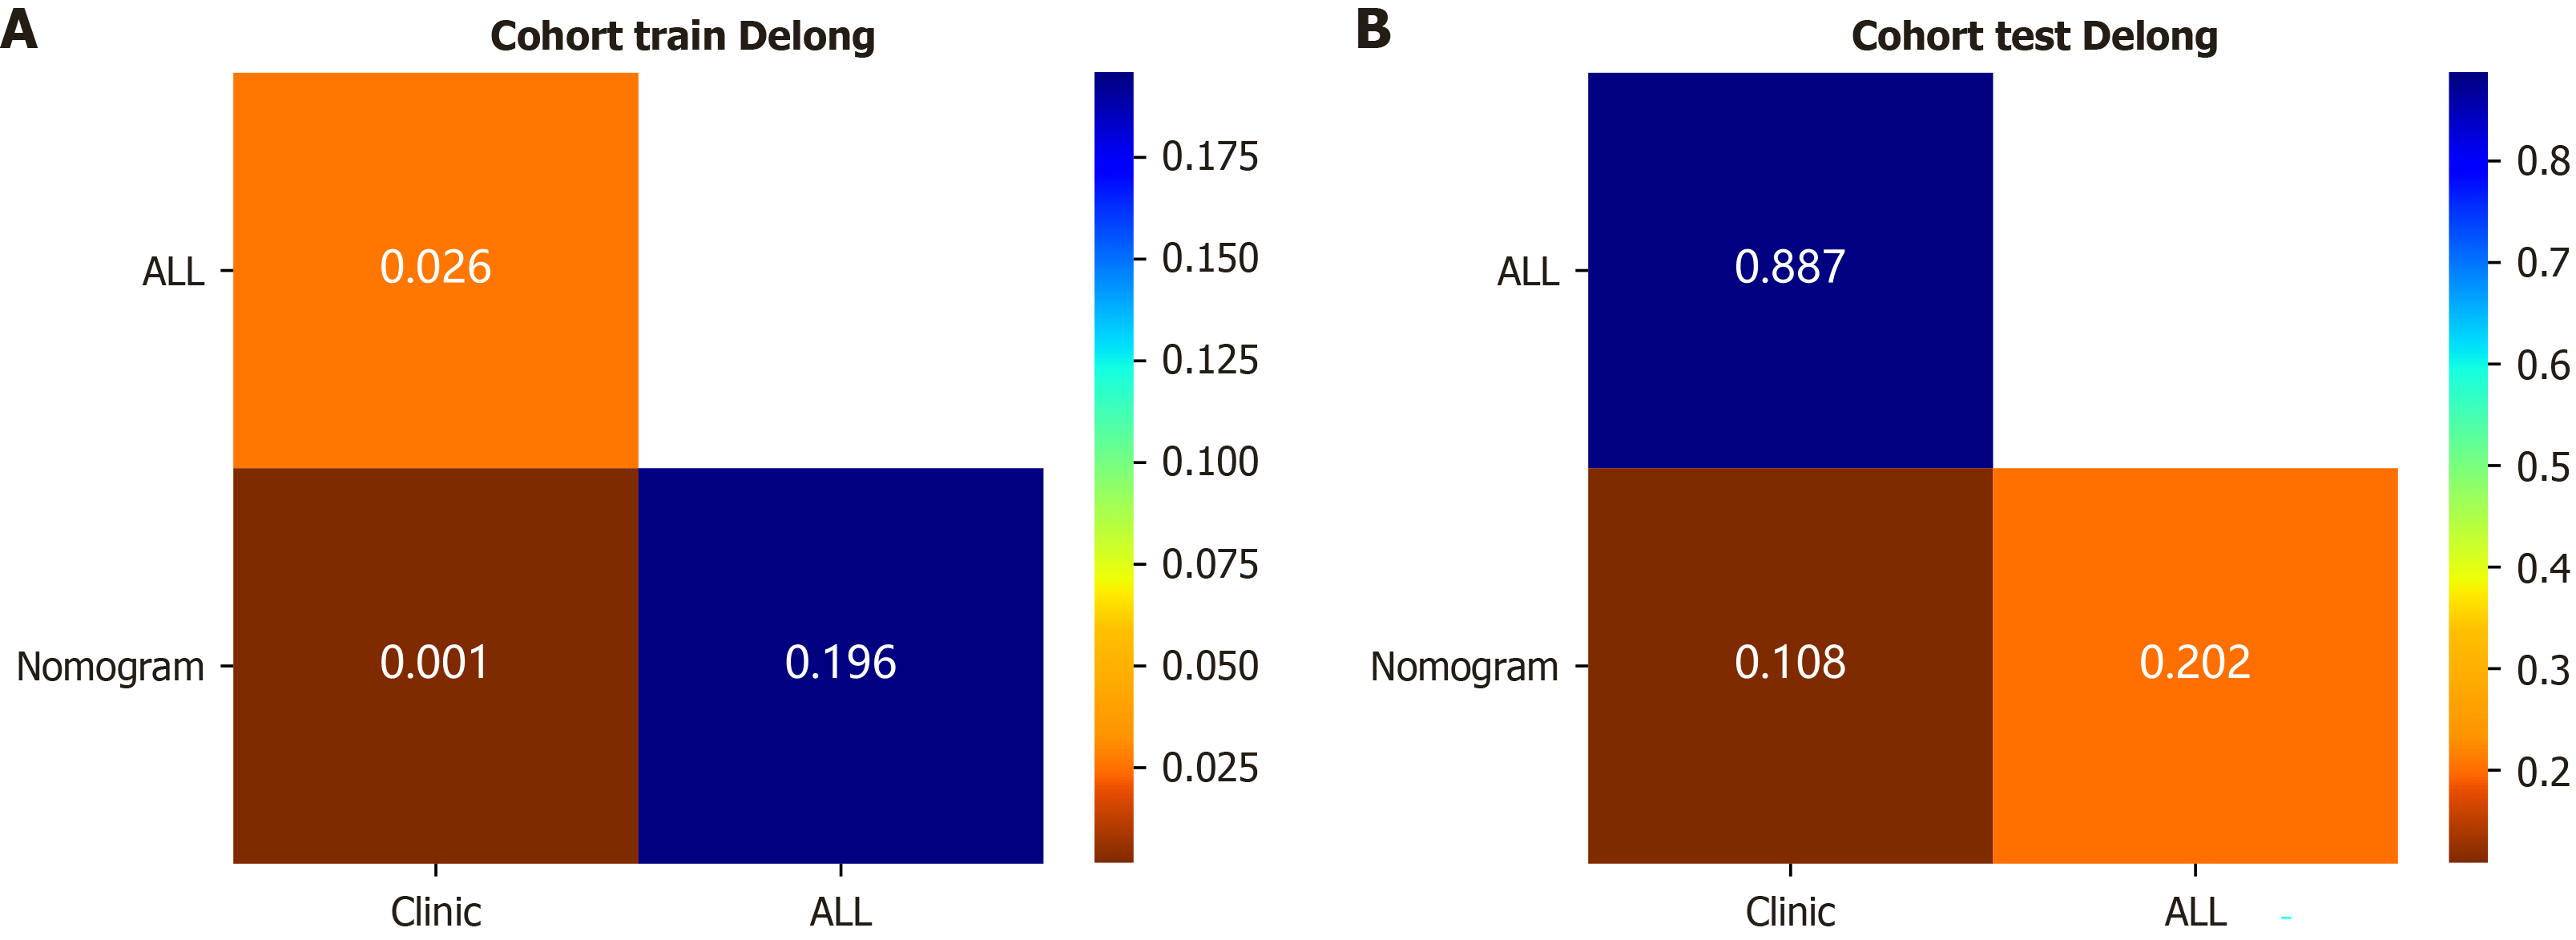
Figure 6 DeLong test comparison of area under the curve values for clinical, radiomics, and combined models in training and testing cohorts.
A: DeLong test results comparing area under the curve values of the clinical model, random forest radiomics model, and combined nomogram model in the training cohort, indicating statistical differences in model performance; B: DeLong test results comparing area under the curve values of the clinical model, random forest radiomics model, and combined nomogram model in the testing cohort, assessing the significance of predictive performance differences on independent data. Clinic: Clinical model; ALL: Random forest radiomics model; Nomogram: Combined model.
- Citation: Zheng ZH, Wu CH, Hu JB, Xu JF, Zi XY, Chen JH, He Q, Dong WY. Computed tomography radiomics-based machine learning nomogram for preoperative prediction of glypican-3 expression in hepatocellular carcinoma. World J Radiol 2026; 18(7): 121161
- URL: https://www.wjgnet.com/1949-8470/full/v18/i7/121161.htm
- DOI: https://dx.doi.org/10.4329/wjr.121161