
















Copyright: ©Author(s) 2026.
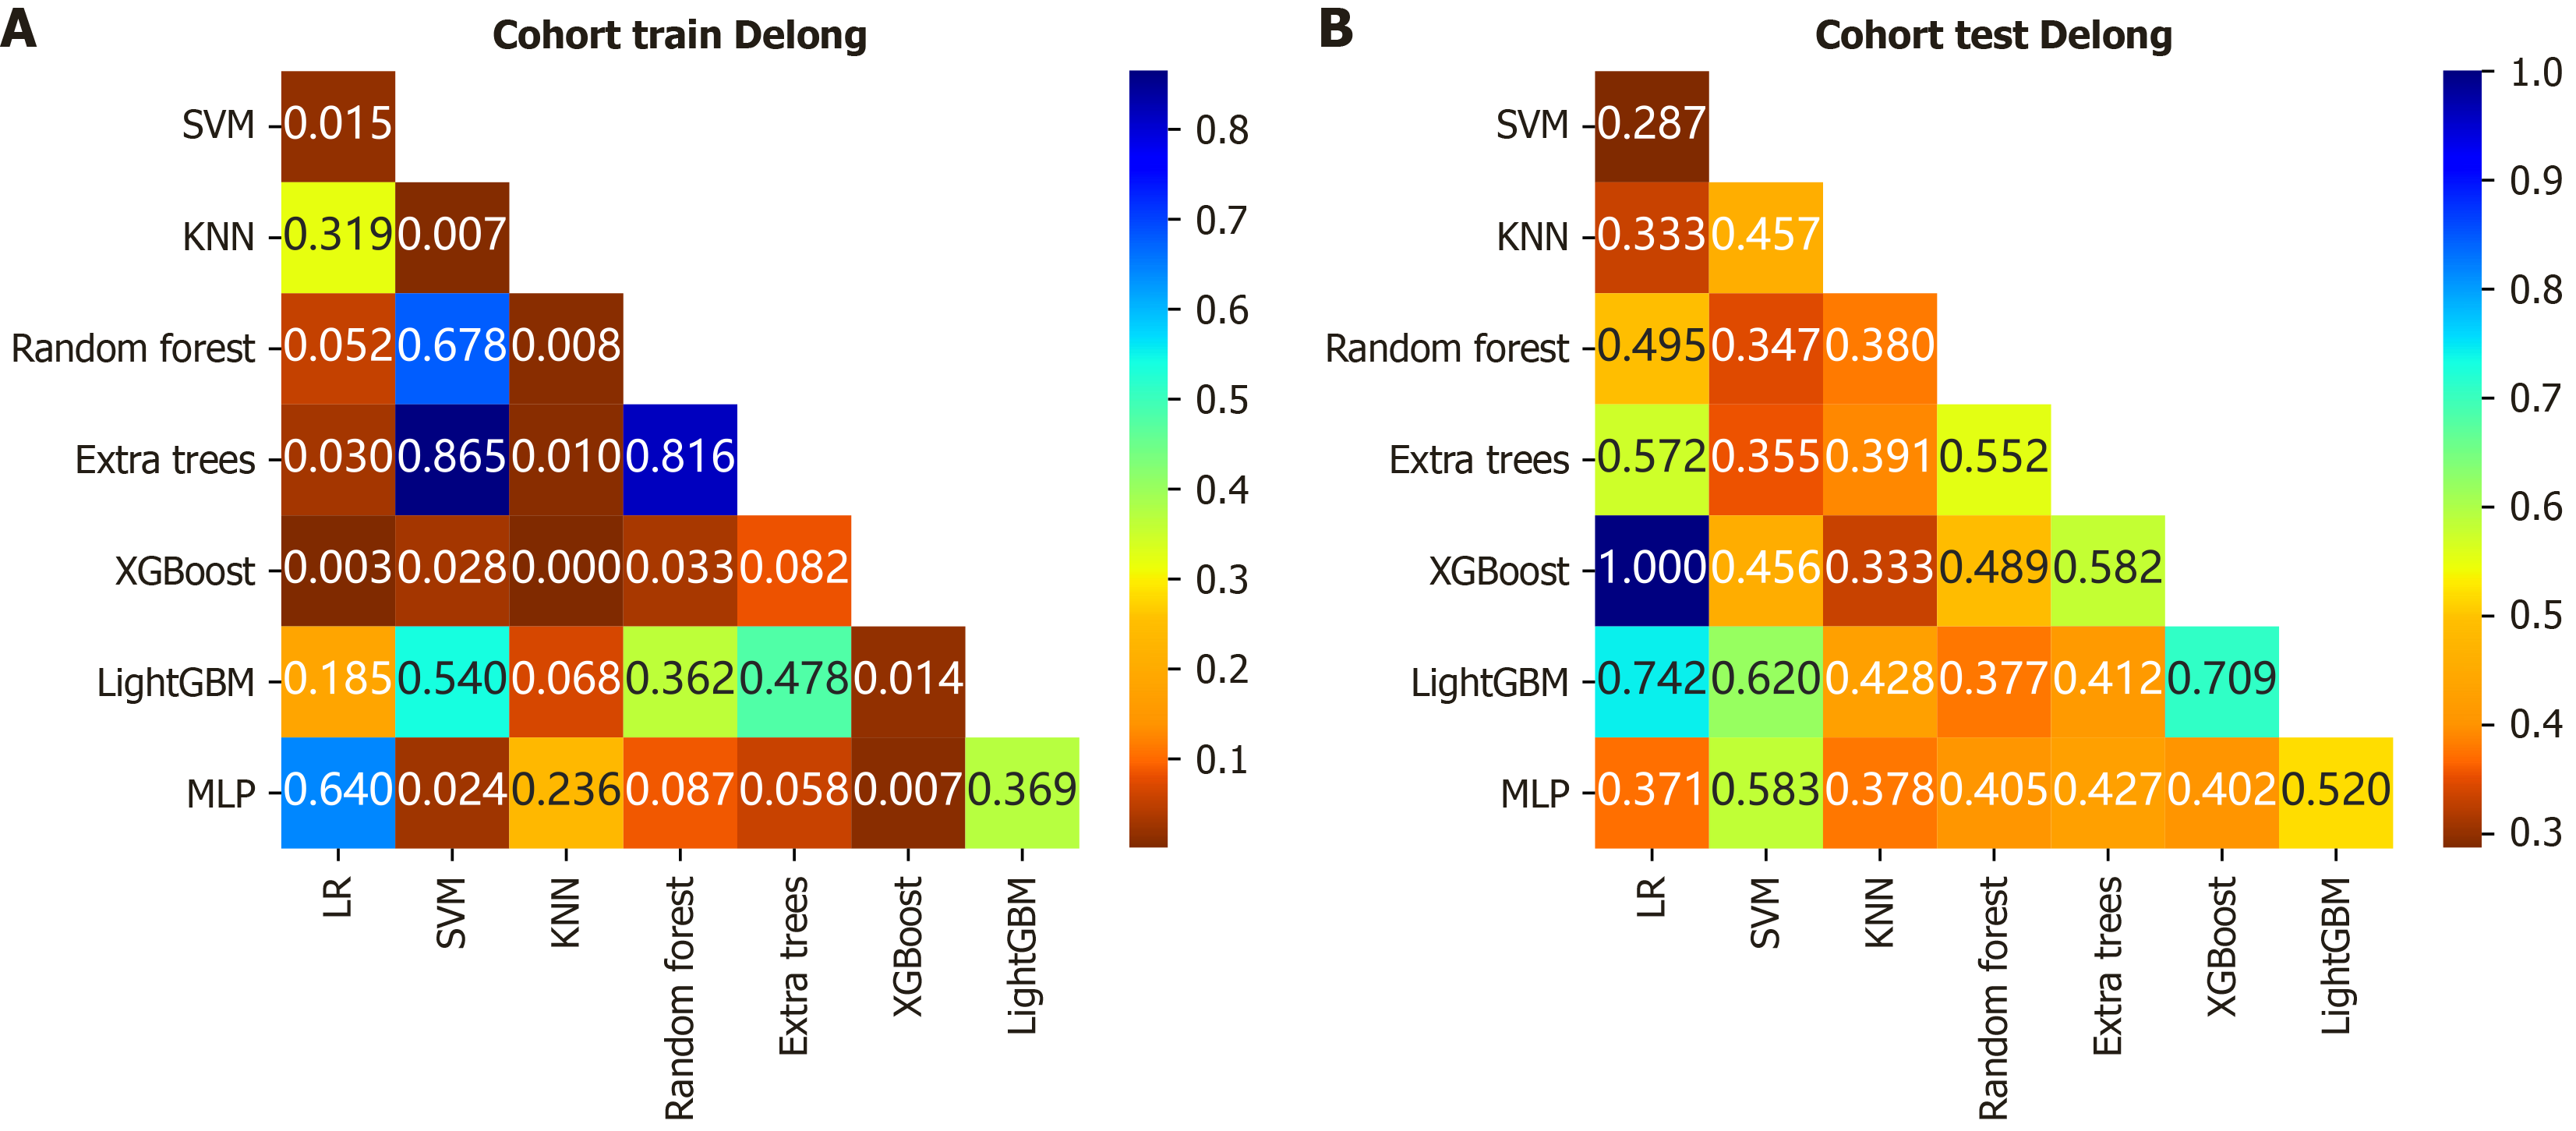
Figure 4 Comparison of area under the curve values for radiomics models using DeLong’s test in training and testing cohorts.
A: DeLong test results comparing area under the curve values of the radiomics model in the training cohort, indicating statistical differences in model performance; B: DeLong test results comparing area under the curve values of the radiomics model in the testing cohort, assessing the significance of predictive performance differences on independent data. KNN: K-nearest neighbors; LightGBM: Light Gradient Boosting Machine; LR: Logistic regression; MLP: Multilayer perceptron; SVM: Support vector machine; XGBoost: Extreme gradient boosting.
- Citation: Zheng ZH, Wu CH, Hu JB, Xu JF, Zi XY, Chen JH, He Q, Dong WY. Computed tomography radiomics-based machine learning nomogram for preoperative prediction of glypican-3 expression in hepatocellular carcinoma. World J Radiol 2026; 18(7): 121161
- URL: https://www.wjgnet.com/1949-8470/full/v18/i7/121161.htm
- DOI: https://dx.doi.org/10.4329/wjr.121161