
















Copyright: ©Author(s) 2026.
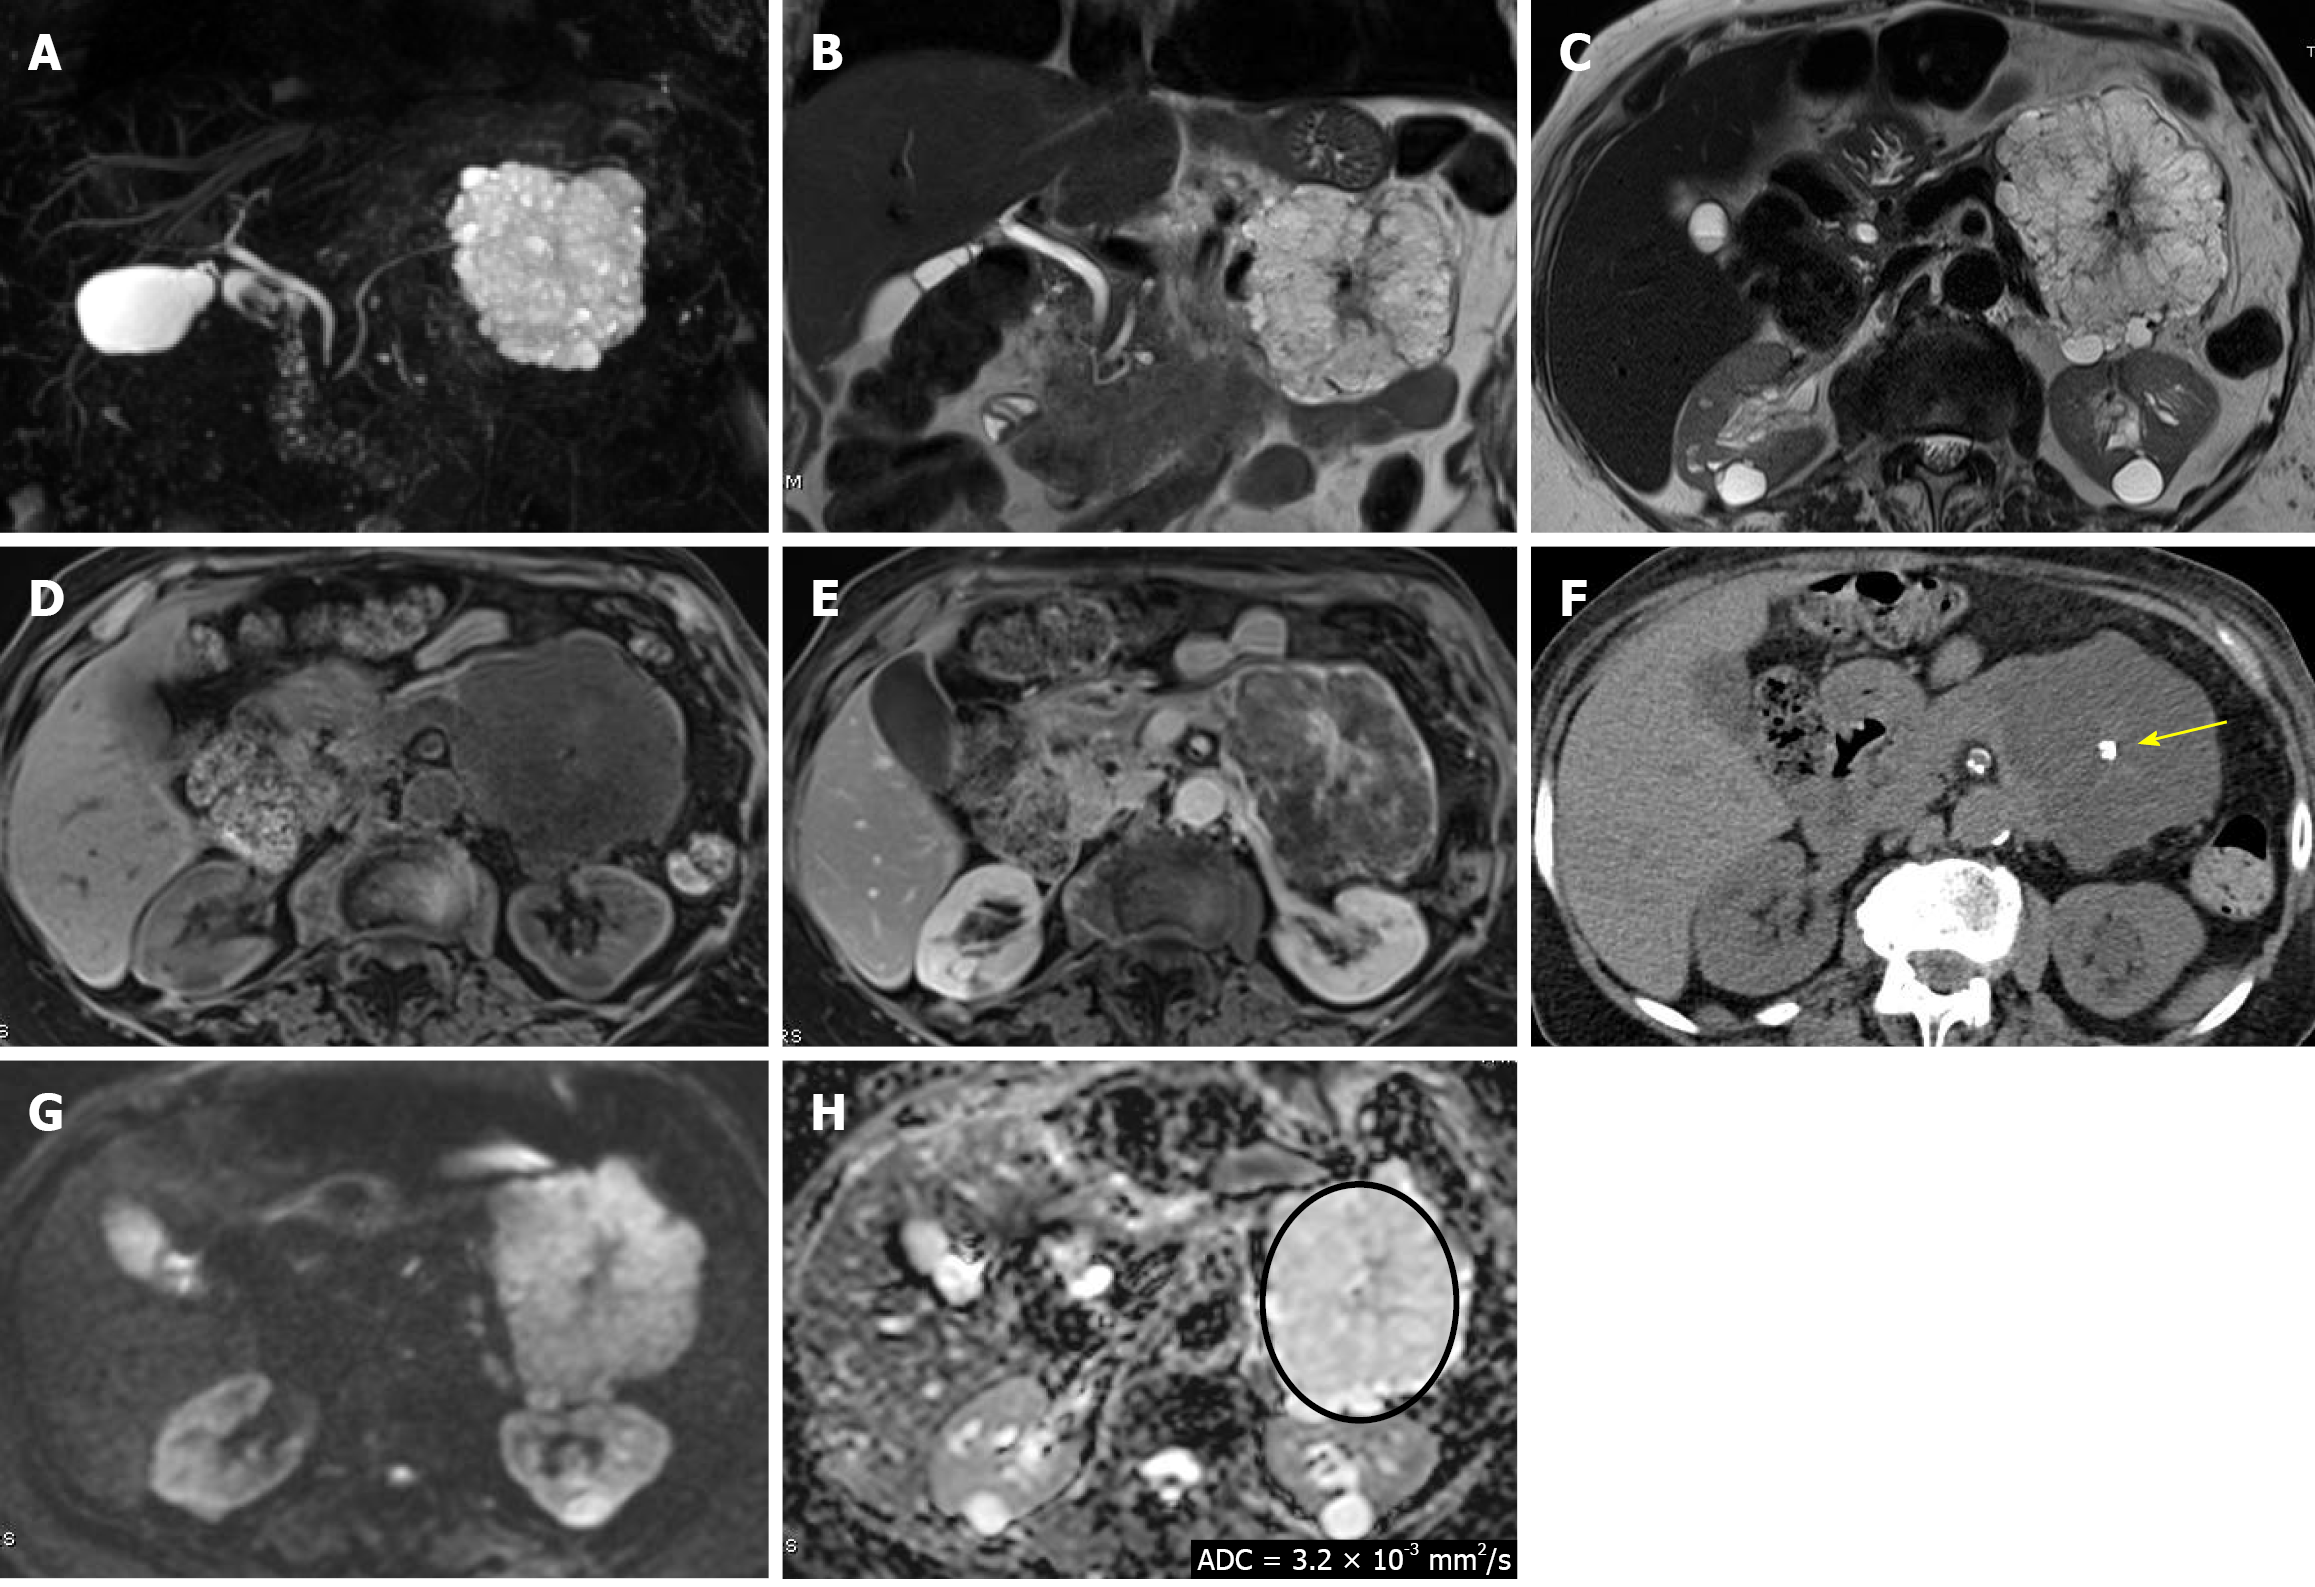
Figure 6 Typical magnetic resonance imaging appearance of serous cystic neoplasm.
A: Magnetic resonance cholangiopancreatography maximum intensity projection reconstruction shows a large microcystic lesion in the pancreatic tail; B and C: Coronal and axial single-shot T2-weighted images demonstrate a markedly hyperintense microcystic mass with thin septa converging toward a central scar; D and E: Pre-contrast and post-contrast T1-weighted images show a hypointense lesion with delayed enhancement of the central scar; F: Non-contrast computed tomography better depictes central scar calcification (arrow); G and H: Diffusion weighted imaging (b = 1000 second/mm2) shows mild hyperintensity on high b values due to T2 shine-through, as confirmed on apparent diffusion coefficient (ADC) map, which presents hyperintense signal, indicating absence of true restriction, and high ADC value (ADC = 3.2 × 10⁻³ mm2/second).
- Citation: Boraschi P, Cervelli R, Donati F. Common cystic pancreatic neoplasms: A comprehensive magnetic resonance imaging-based review of typical and atypical imaging features. World J Radiol 2026; 18(7): 120526
- URL: https://www.wjgnet.com/1949-8470/full/v18/i7/120526.htm
- DOI: https://dx.doi.org/10.4329/wjr.120526