
















Copyright: ©Author(s) 2026.
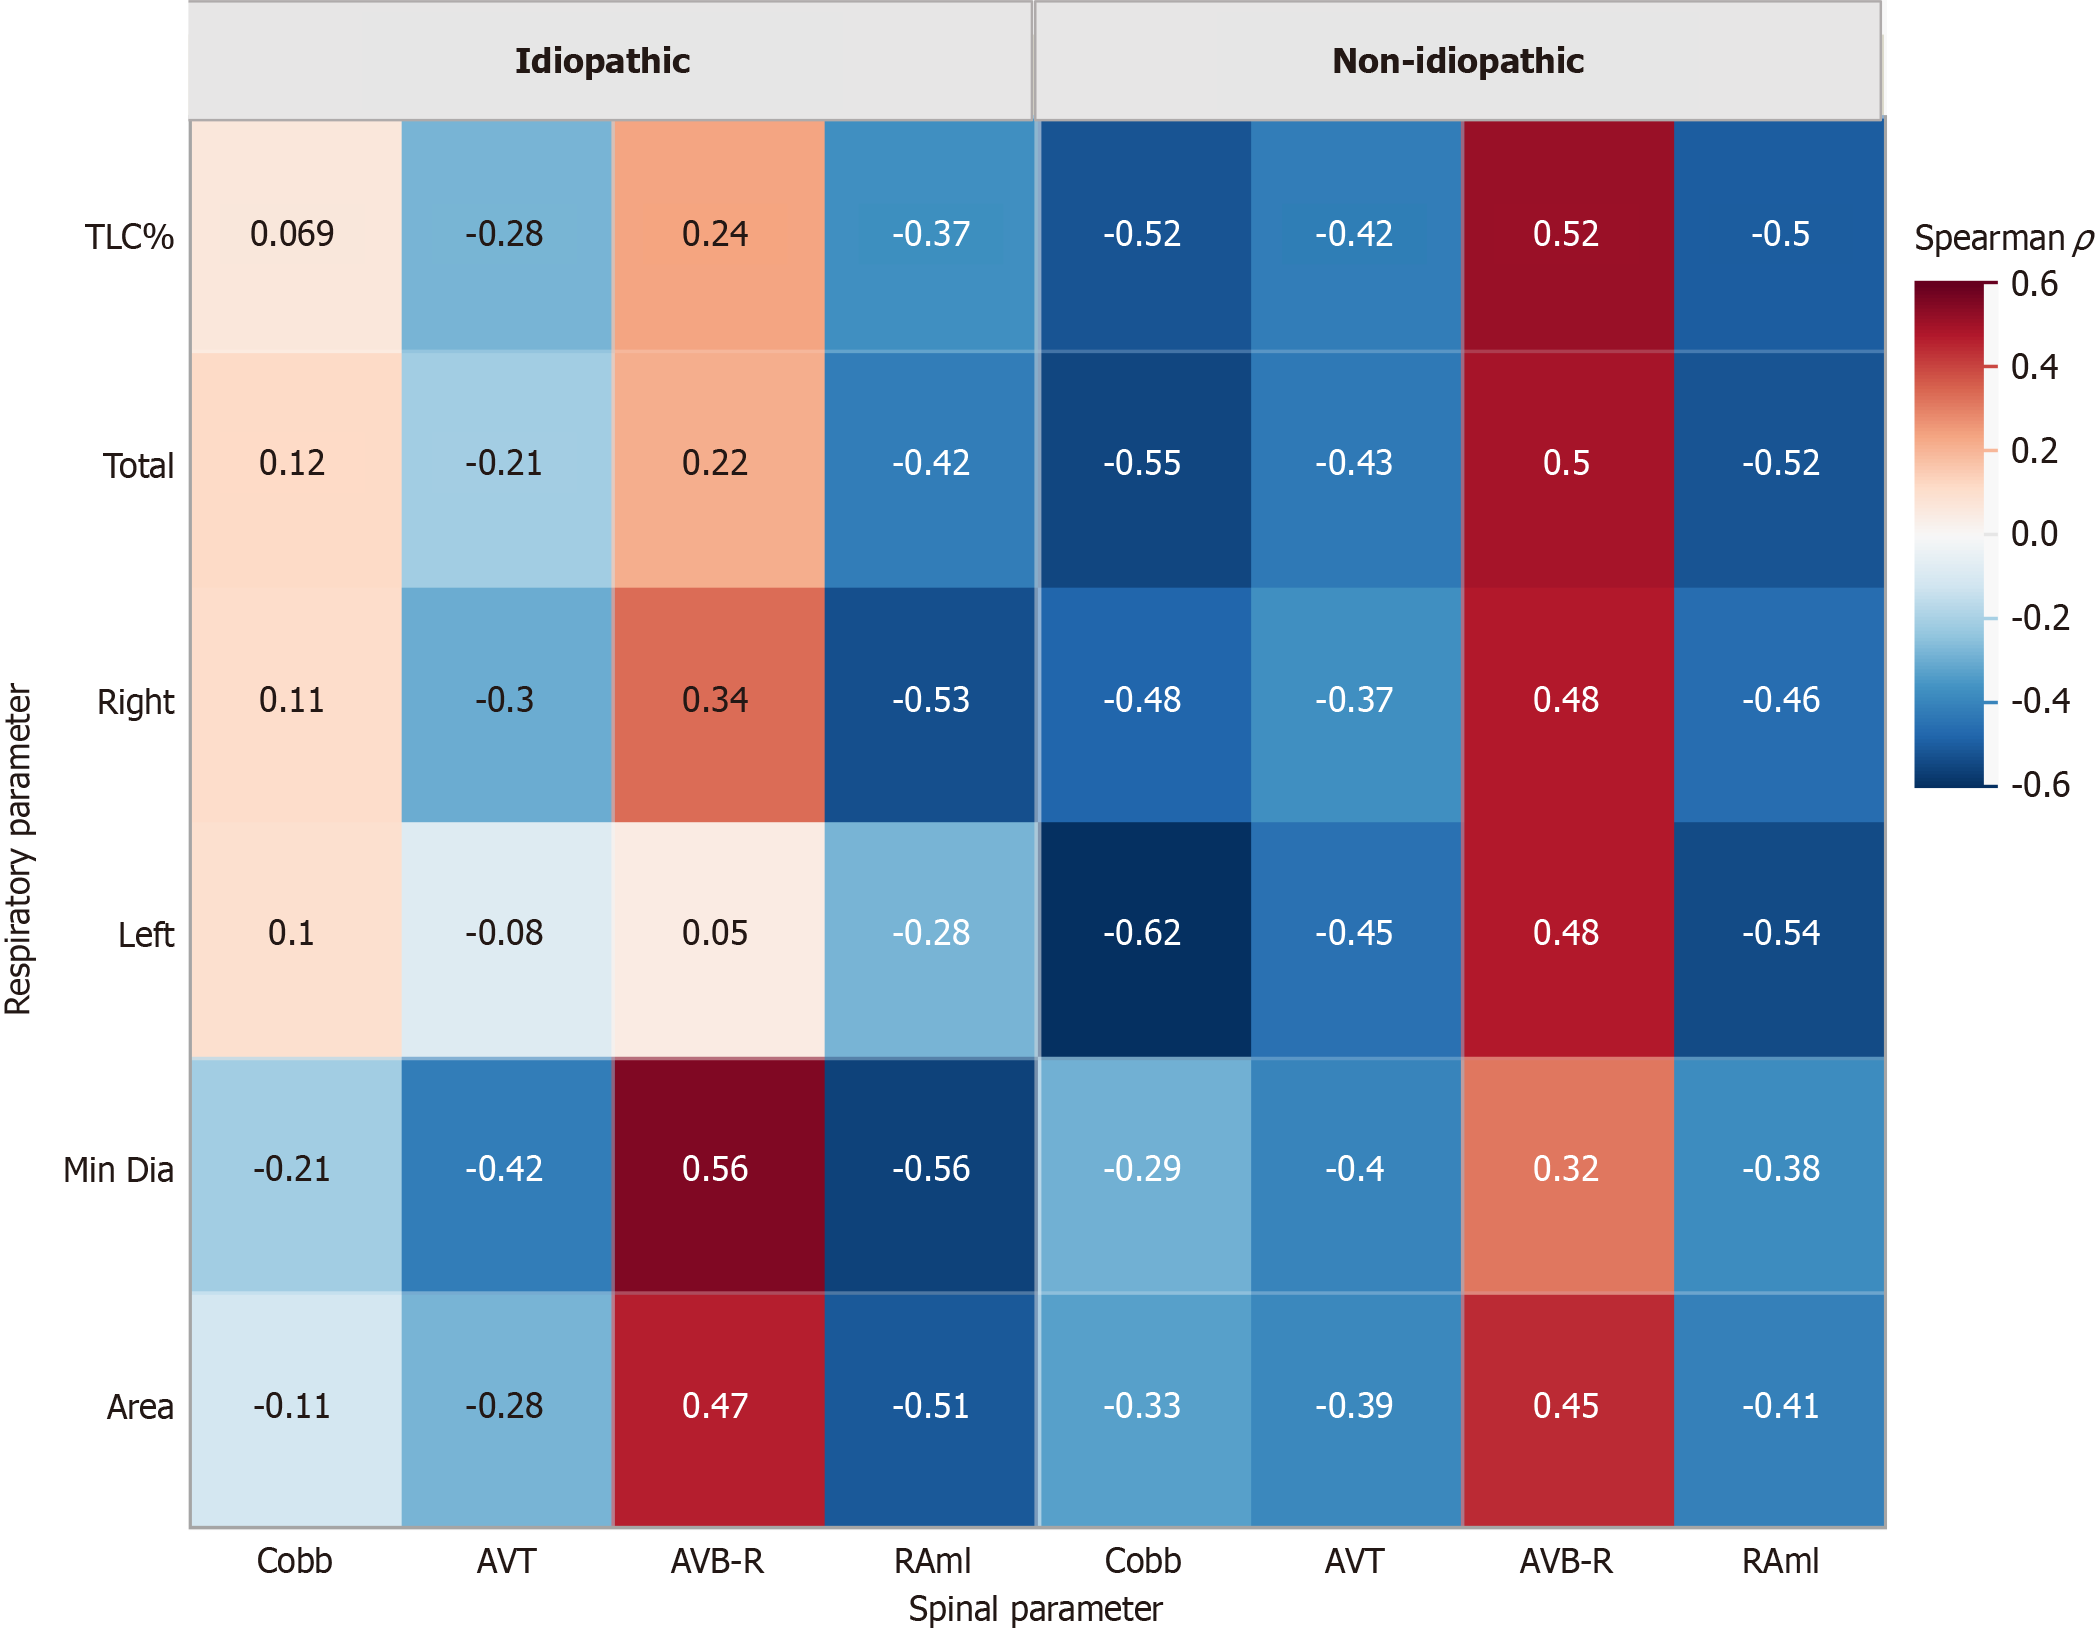
Figure 5 Heatmap of Spearman’s rank correlations between spinal thoracic deformity parameters and computed tomography-derived respiratory function parameters.
Heatmaps illustrate Spearman’s rank correlation coefficients (ρ) between spinal deformity parameters (columns) and computed tomography-derived respiratory parameters (rows), shown separately for idiopathic scoliosis (left) and non-idiopathic scoliosis (right). Colors indicate correlation strength and direction, ranging from negative (blue) to positive (red), with white indicating values near zero. Numerical values within each cell represent Spearman’s ρ. Correlation patterns differed between groups, with non-idiopathic scoliosis showing generally stronger negative associations between deformity severity and respiratory parameters. Area means cross-sectional area of the narrowest tracheal segment. Min Dia: Minimum diameter of the narrowest tracheal segment; AVT: Apical vertebral translation; AVB-R: Apical vertebral body-rib ratio; RAml: Rotation relative to anterior midline; RAsag: Rotation relative to sagittal plane; TLC%: Predicted total lung capacity percentage.
- Citation: Tsuchiya N, Yogi S, Yogi A, Iida G, Yonemoto K, Shimabukuro T, Nishida K, Nishie A. Computed tomography-derived assessment of respiratory impairment in thoracic scoliosis: Comparison between idiopathic and non-idiopathic etiologies. World J Radiol 2026; 18(6): 119975
- URL: https://www.wjgnet.com/1949-8470/full/v18/i6/119975.htm
- DOI: https://dx.doi.org/10.4329/wjr.119975