
















Copyright: ©Author(s) 2026.
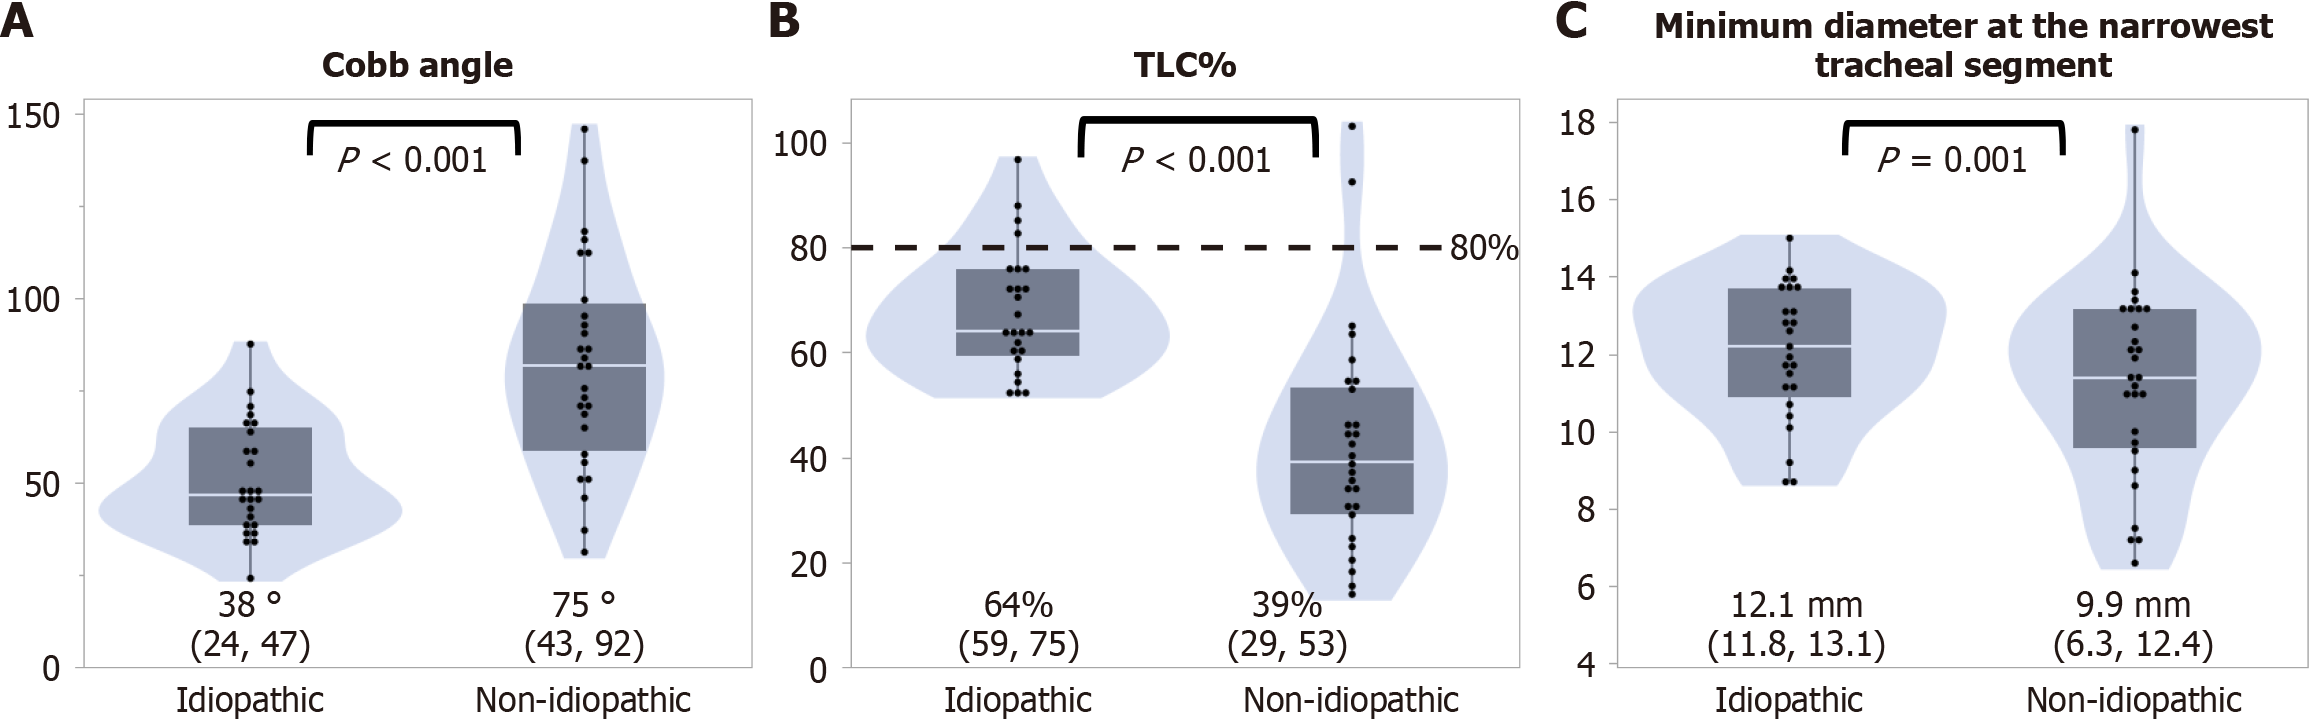
Figure 4 Comparison of spinal deformity and computed tomography-derived respiratory parameters between idiopathic and non-idiopathic scoliosis.
A: Cobb angle; B: Predicted total lung capacity percentage (TLC%); C: Minimum diameter at the narrowest tracheal segment. Data are presented as violin plots with overlaid box-and-whisker plots and individual data points. Patients with non-idiopathic scoliosis showed significantly larger Cobb angles, lower TLC%, and smaller airway diameters. The dashed horizontal line in panel B indicates a TLC% of 80%. Group comparisons were performed using the Wilcoxon rank-sum test. TLC%: Predicted total lung capacity percentage.
- Citation: Tsuchiya N, Yogi S, Yogi A, Iida G, Yonemoto K, Shimabukuro T, Nishida K, Nishie A. Computed tomography-derived assessment of respiratory impairment in thoracic scoliosis: Comparison between idiopathic and non-idiopathic etiologies. World J Radiol 2026; 18(6): 119975
- URL: https://www.wjgnet.com/1949-8470/full/v18/i6/119975.htm
- DOI: https://dx.doi.org/10.4329/wjr.119975