
















Copyright: ©Author(s) 2026.
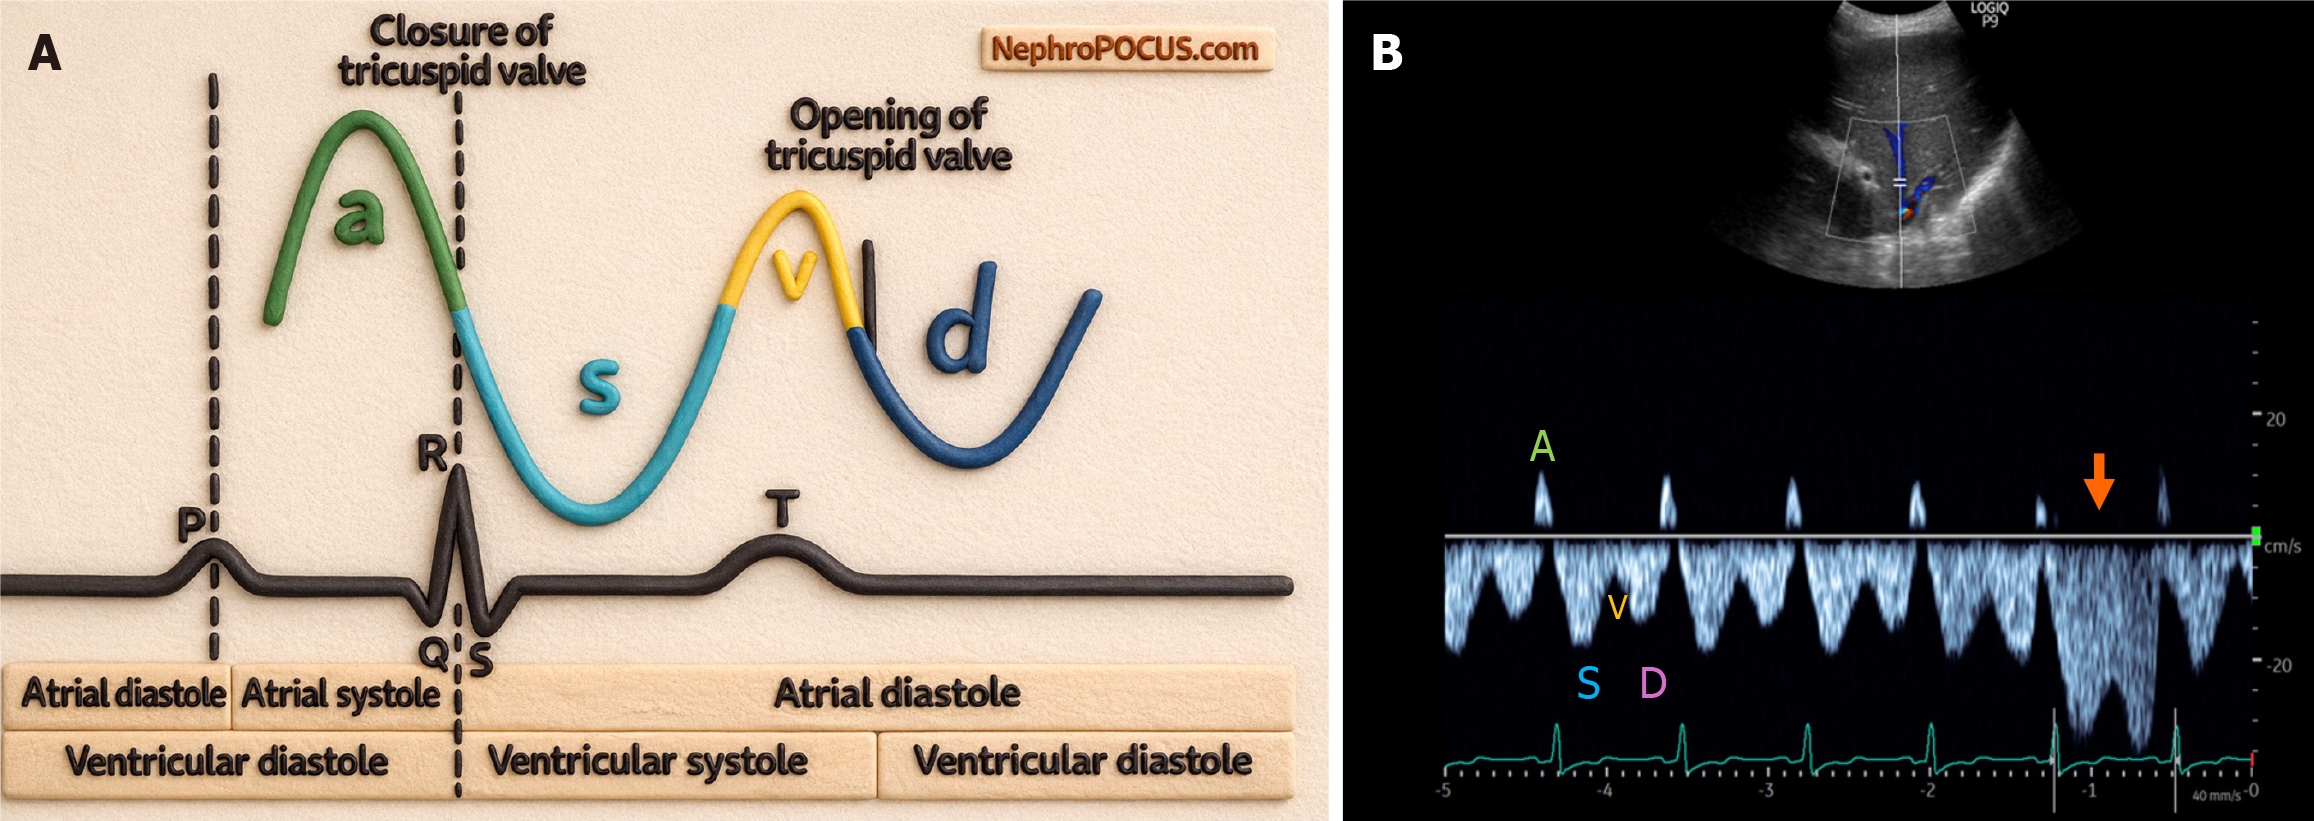
Figure 1 Hepatic vein Doppler waveforms with electrocardiographic correlation.
A: Schematic representation; B: Representative waveforms. Arrow in panel B indicates inspiratory increase in forward velocities. Figure are reproduced with permission from NephroPOCUS.com. The corresponding author (Abhilash Koratala), as the owner of the website, has authorized the use of these figures in this manuscript by all authors. P Proof of ownership can be found on the ‘About’ page of the website: https://nephropocus.com/about/.
- Citation: Shah C, Shah D, Koratala A. Venous excess doppler ultrasound: What radiologists should know in 2026. World J Radiol 2026; 18(6): 119110
- URL: https://www.wjgnet.com/1949-8470/full/v18/i6/119110.htm
- DOI: https://dx.doi.org/10.4329/wjr.119110