
















Copyright: ©Author(s) 2026.
World J Radiol. May 28, 2026; 18(5): 119048
Published online May 28, 2026. doi: 10.4329/wjr.v18.i5.119048
Published online May 28, 2026. doi: 10.4329/wjr.v18.i5.119048
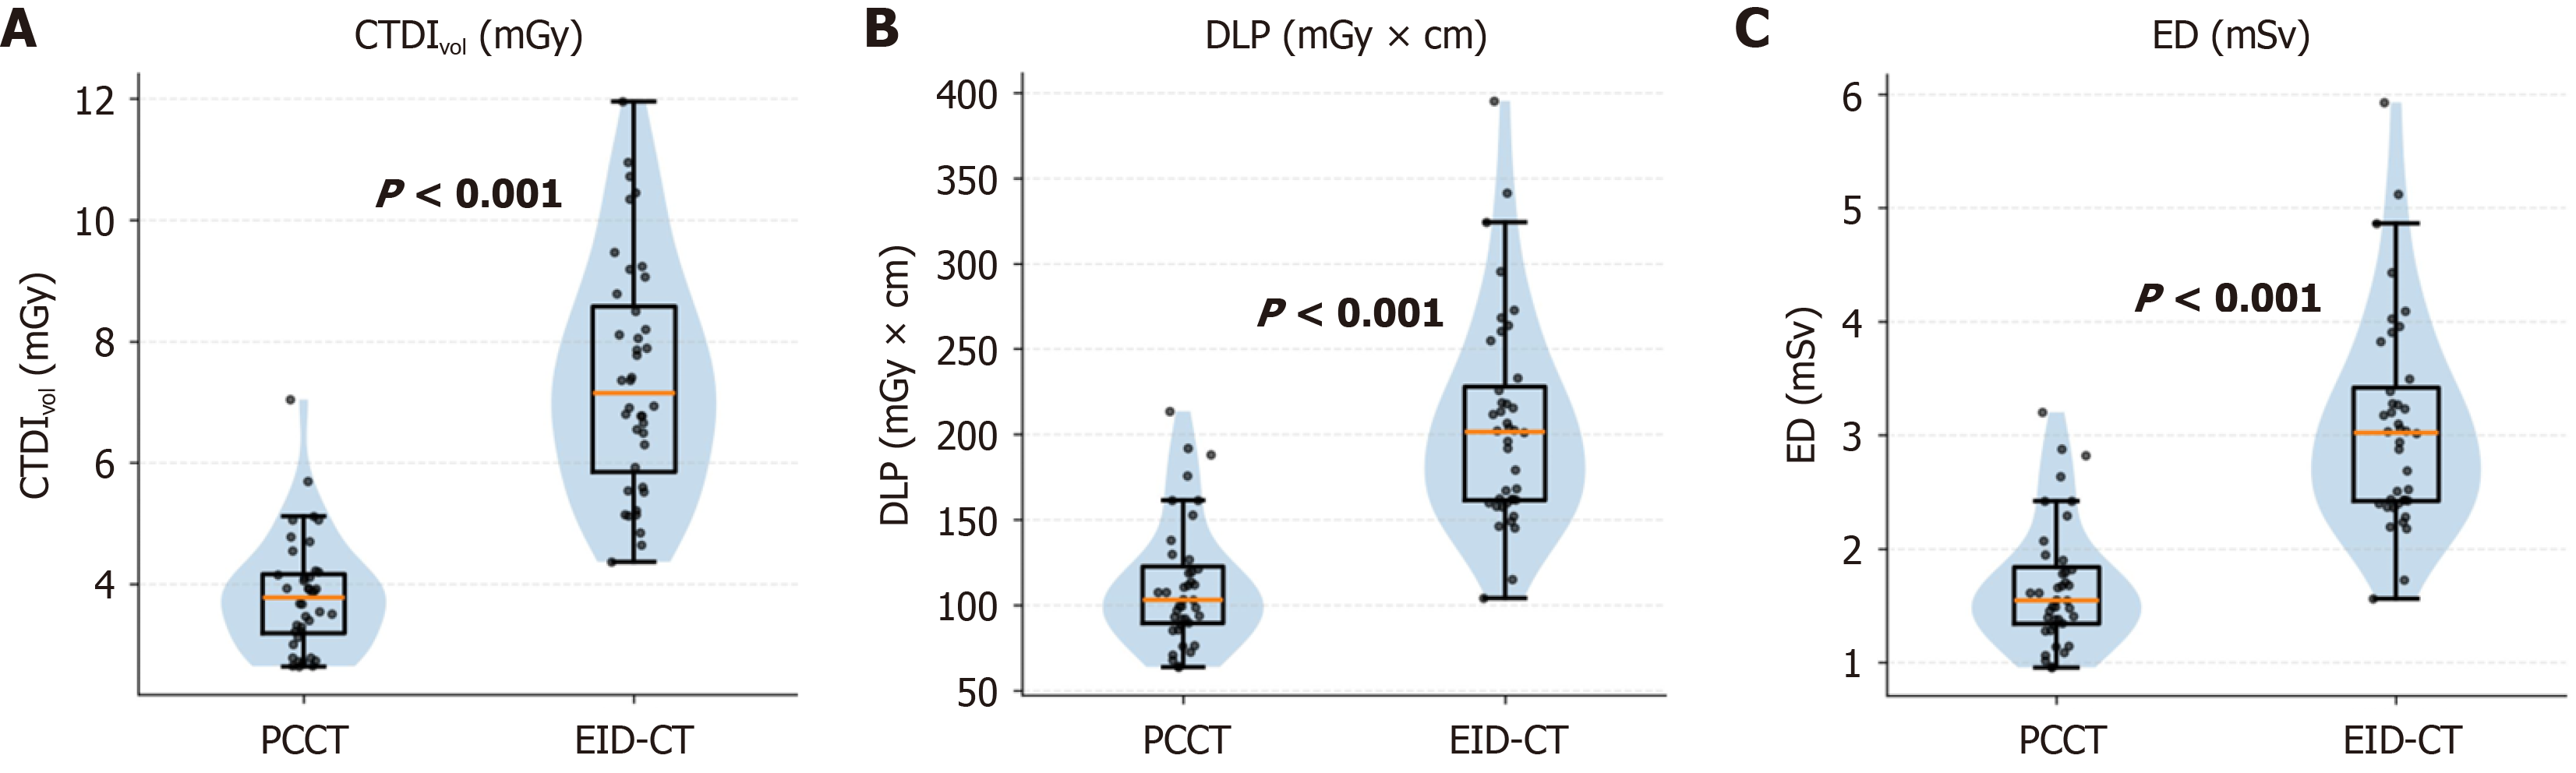
Figure 2 Violin plot comparison of radiation dose parameters between the photon-counting computed tomography and energy-integrating detector computed tomography groups.
A: Computed tomography dose index (mGy): Comparison of volume computed tomography dose index between the photon-counting computed tomography (PCCT) and energy-integrating detector computed tomography (EID-CT) groups; B: Dose-length product (mGy × cm): Comparison of dose-length product between the PCCT and EID-CT groups; C: Effective dose (mSv): Comparison of effective dose between the PCCT and EID-CT groups. CTDIvol: Computed tomography dose index; DLP: Dose-length product; EID-CT: Energy-integrating detector computed tomography; PCCT: Photon-counting computed tomography; ED: Effective dose.
- Citation: Zhu TT, Zhu XY, Yang M, Liu WM, Yang WJ, Liu X. Photon-counting computed tomography enables low-dose, high-quality abdominal imaging: A comparative study with energy-integrating detector computed tomography. World J Radiol 2026; 18(5): 119048
- URL: https://www.wjgnet.com/1949-8470/full/v18/i5/119048.htm
- DOI: https://dx.doi.org/10.4329/wjr.v18.i5.119048