
















Copyright: ©Author(s) 2026.
World J Radiol. Apr 28, 2026; 18(4): 120706
Published online Apr 28, 2026. doi: 10.4329/wjr.v18.i4.120706
Published online Apr 28, 2026. doi: 10.4329/wjr.v18.i4.120706
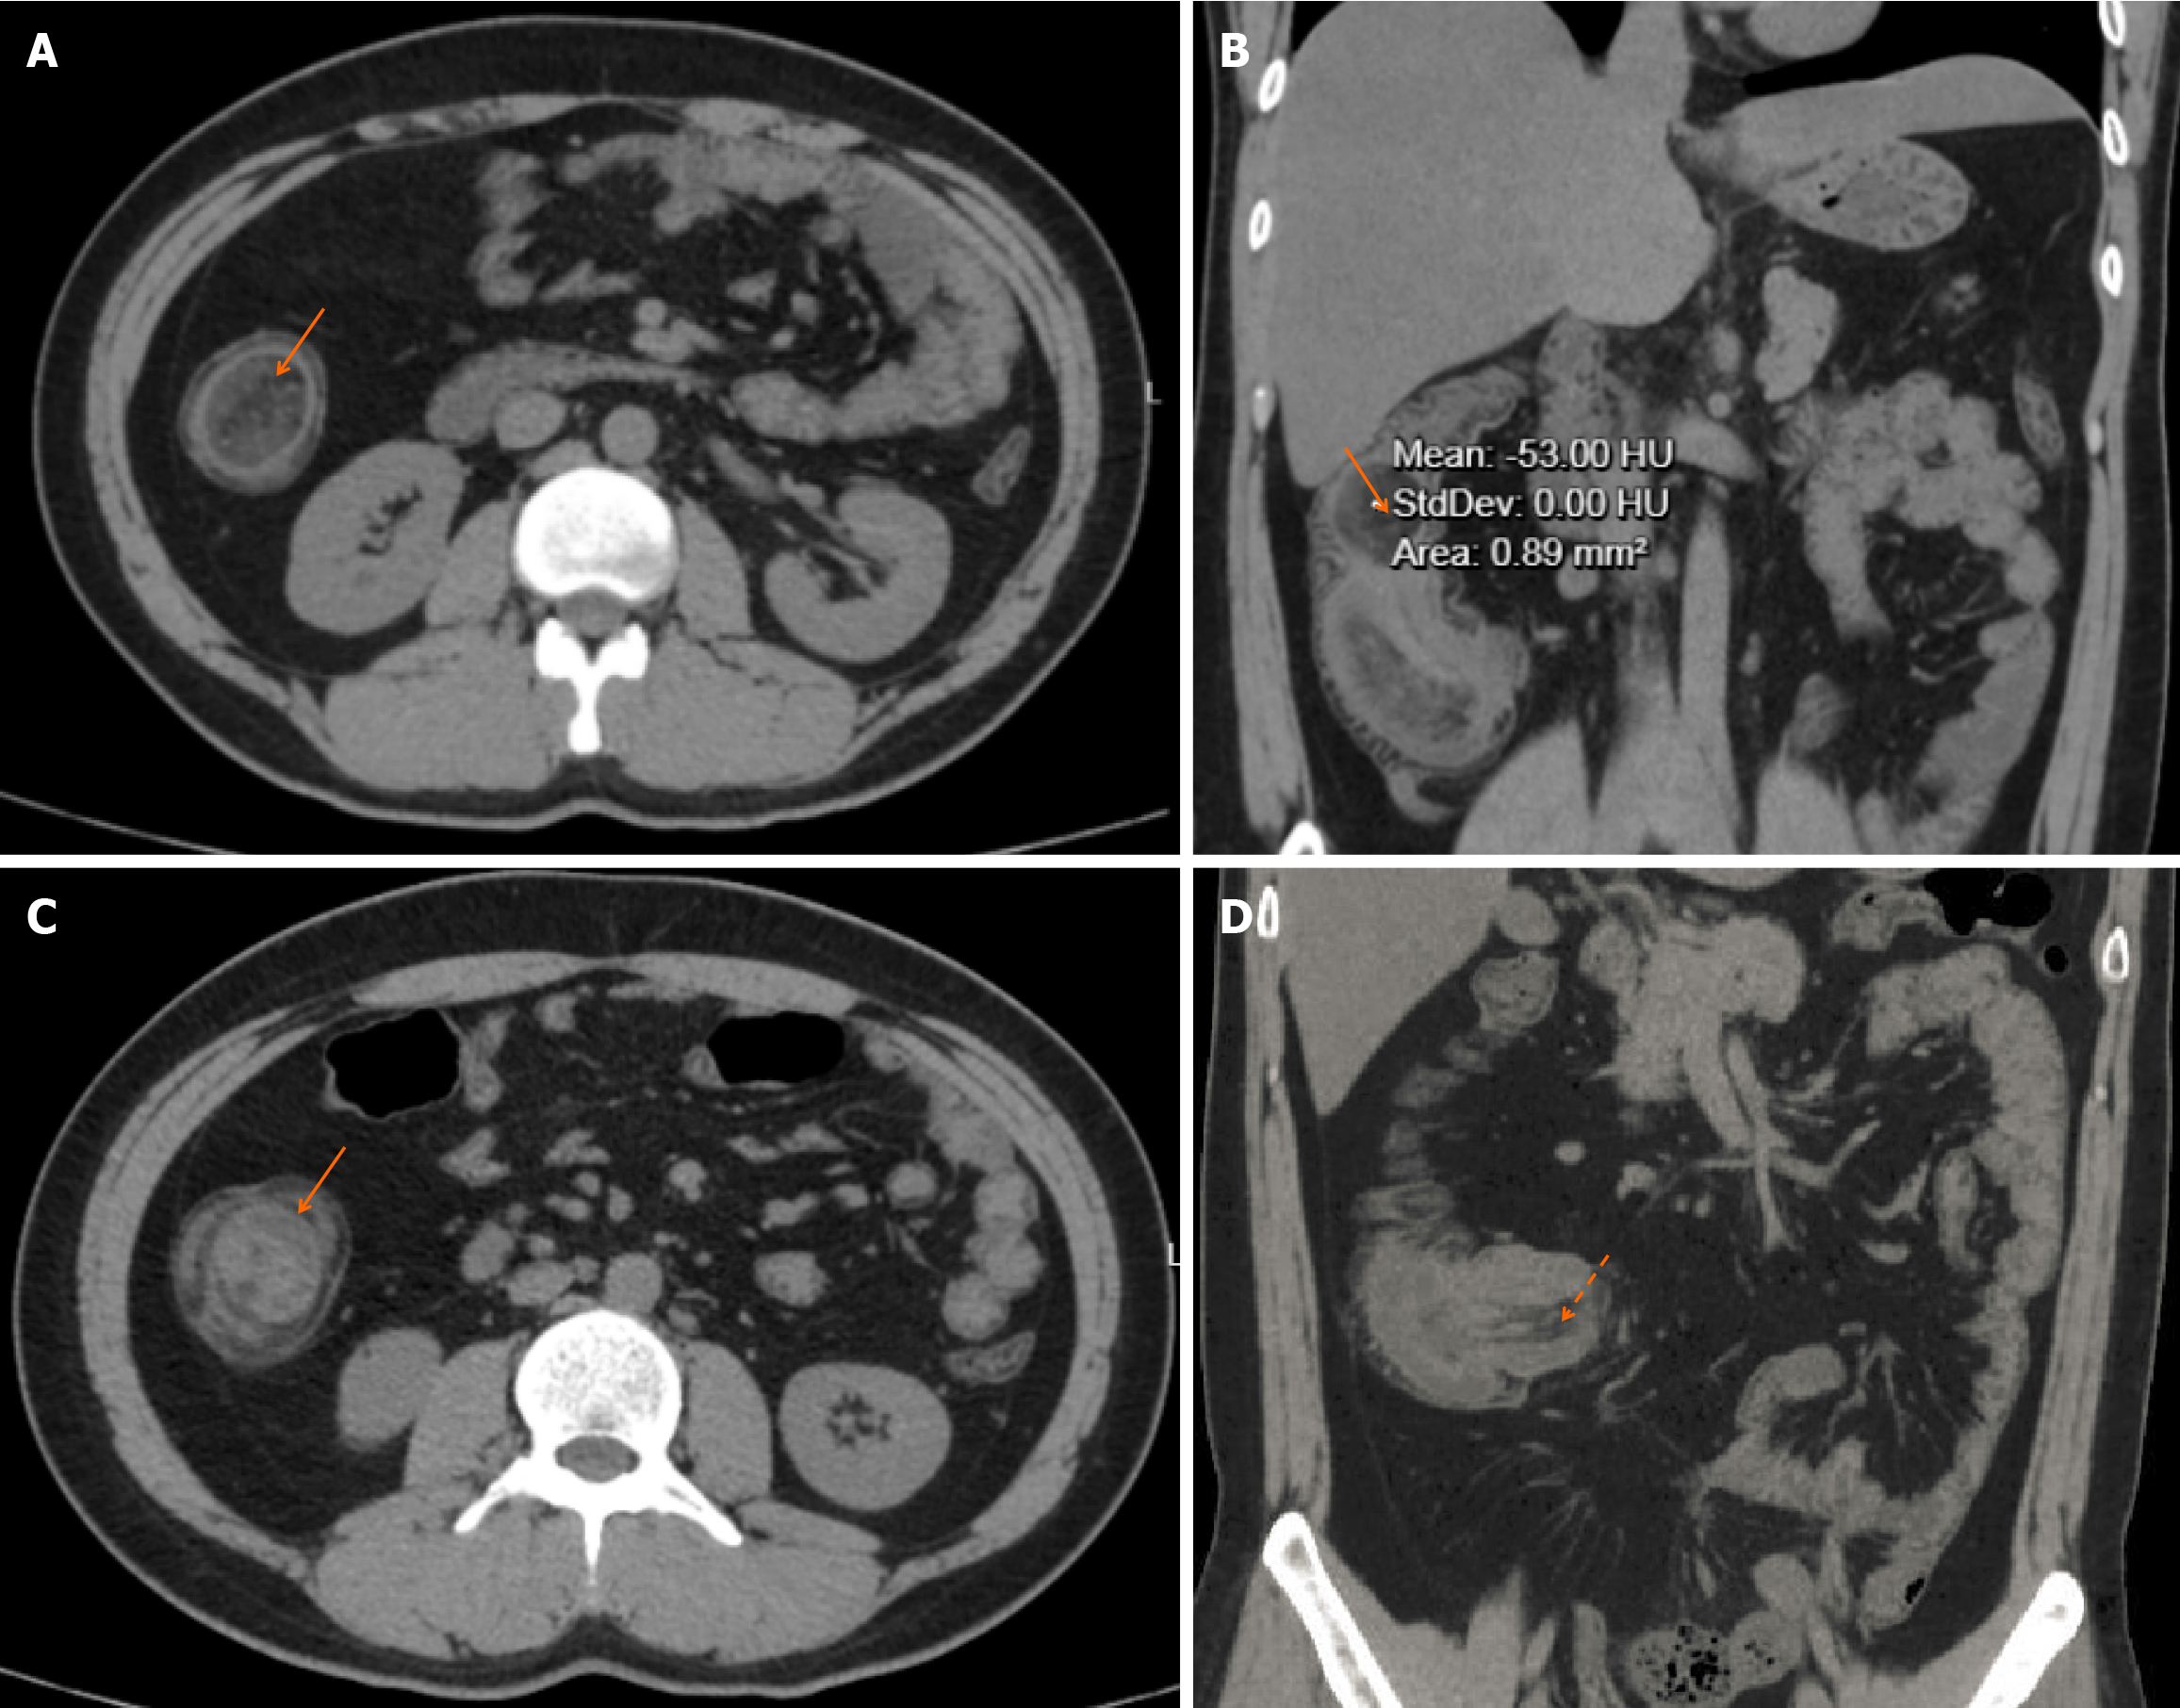
Figure 1 Abdominal computed tomography.
A and B: Axial and coronal computed tomography (CT) images showing a well-circumscribed, oval-shaped mass (arrow) with homogeneous fat attenuation (approximately -53 Hounsfield units) within the ascending colon, pathognomonic for a lipoma, acting as the lead point for the intussusception; C: Axial CT image demonstrating the “target sign” (arrow), formed by the concentric rings of the edematous intussusceptum within the intussuscipiens; D: Coronal CT image showing the elongated intussuscepted bowel loop, known as the “sausage sign” (dashed arrow). HU: Hounsfield units.
- Citation: Fan JX, Jiang YP, Yao MQ. Adult ileocolic intussusception caused by a terminal ileal lipoma: A case report. World J Radiol 2026; 18(4): 120706
- URL: https://www.wjgnet.com/1949-8470/full/v18/i4/120706.htm
- DOI: https://dx.doi.org/10.4329/wjr.v18.i4.120706