















Copyright: ©Author(s) 2026.
World J Radiol. Apr 28, 2026; 18(4): 119851
Published online Apr 28, 2026. doi: 10.4329/wjr.v18.i4.119851
Published online Apr 28, 2026. doi: 10.4329/wjr.v18.i4.119851
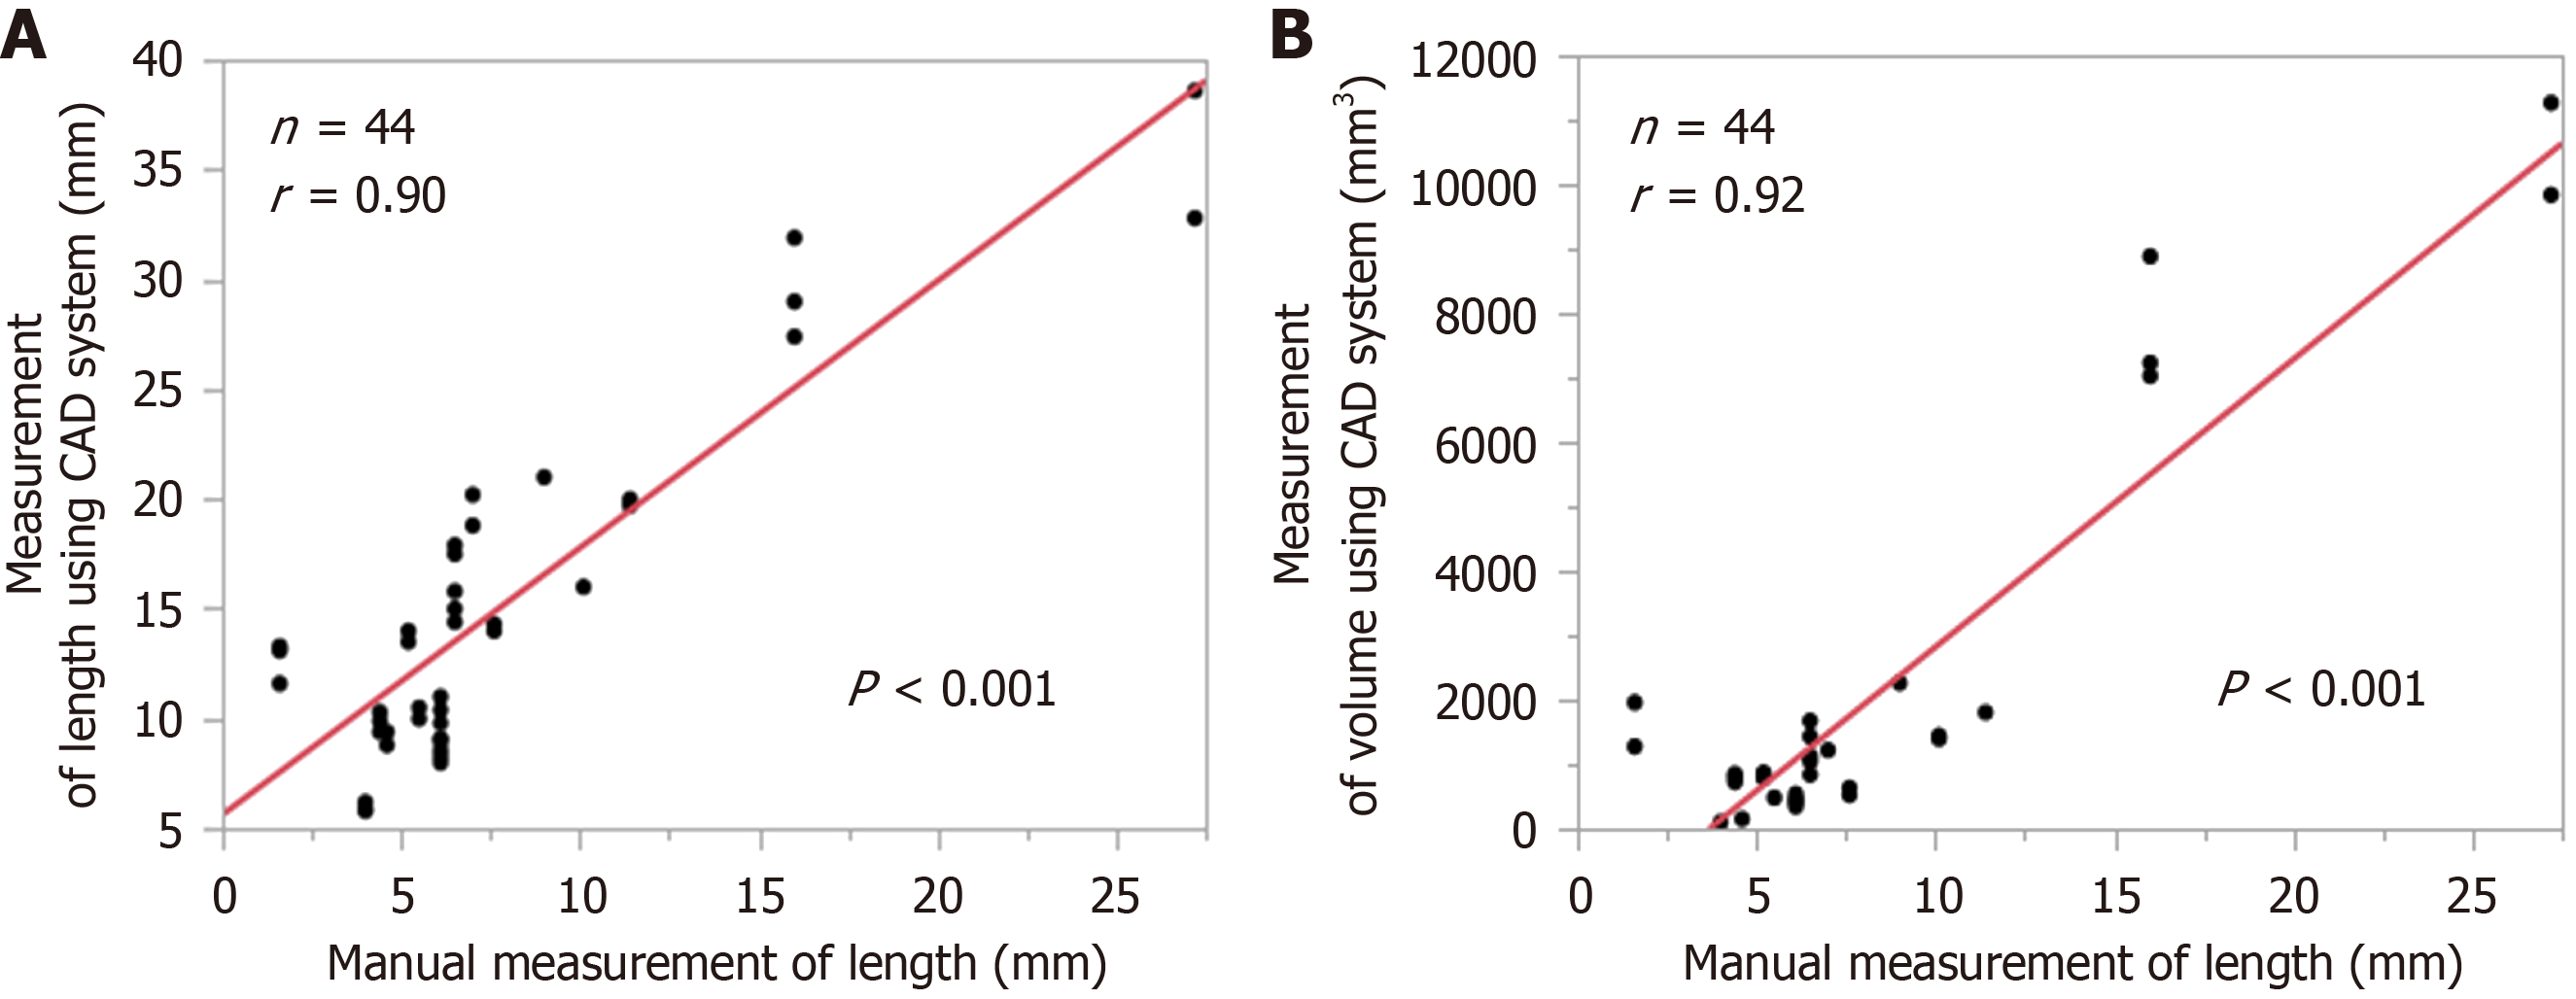
Figure 3 Correlation of lesion measurements between the computer-aided detection system and manual assessment.
Pearson’s correlation coefficient (r) and corresponding P values are shown. A and B: Scatter plots demonstrating the correlation between computer-aided detection-measured maximum lesion length and computer-aided detection-measured lesion volume and the manually measured maximum lesion length. CAD: Computer-aided detection.
- Citation: Azama K, Tsuchiya N, Toyosato S, Yonemoto K, Nishie A. Artificial intelligence-based lung nodule detection for pulmonary arteriovenous fistulas on chest computed tomography. World J Radiol 2026; 18(4): 119851
- URL: https://www.wjgnet.com/1949-8470/full/v18/i4/119851.htm
- DOI: https://dx.doi.org/10.4329/wjr.v18.i4.119851