
















Copyright: ©Author(s) 2026.
World J Radiol. Mar 28, 2026; 18(3): 116826
Published online Mar 28, 2026. doi: 10.4329/wjr.v18.i3.116826
Published online Mar 28, 2026. doi: 10.4329/wjr.v18.i3.116826
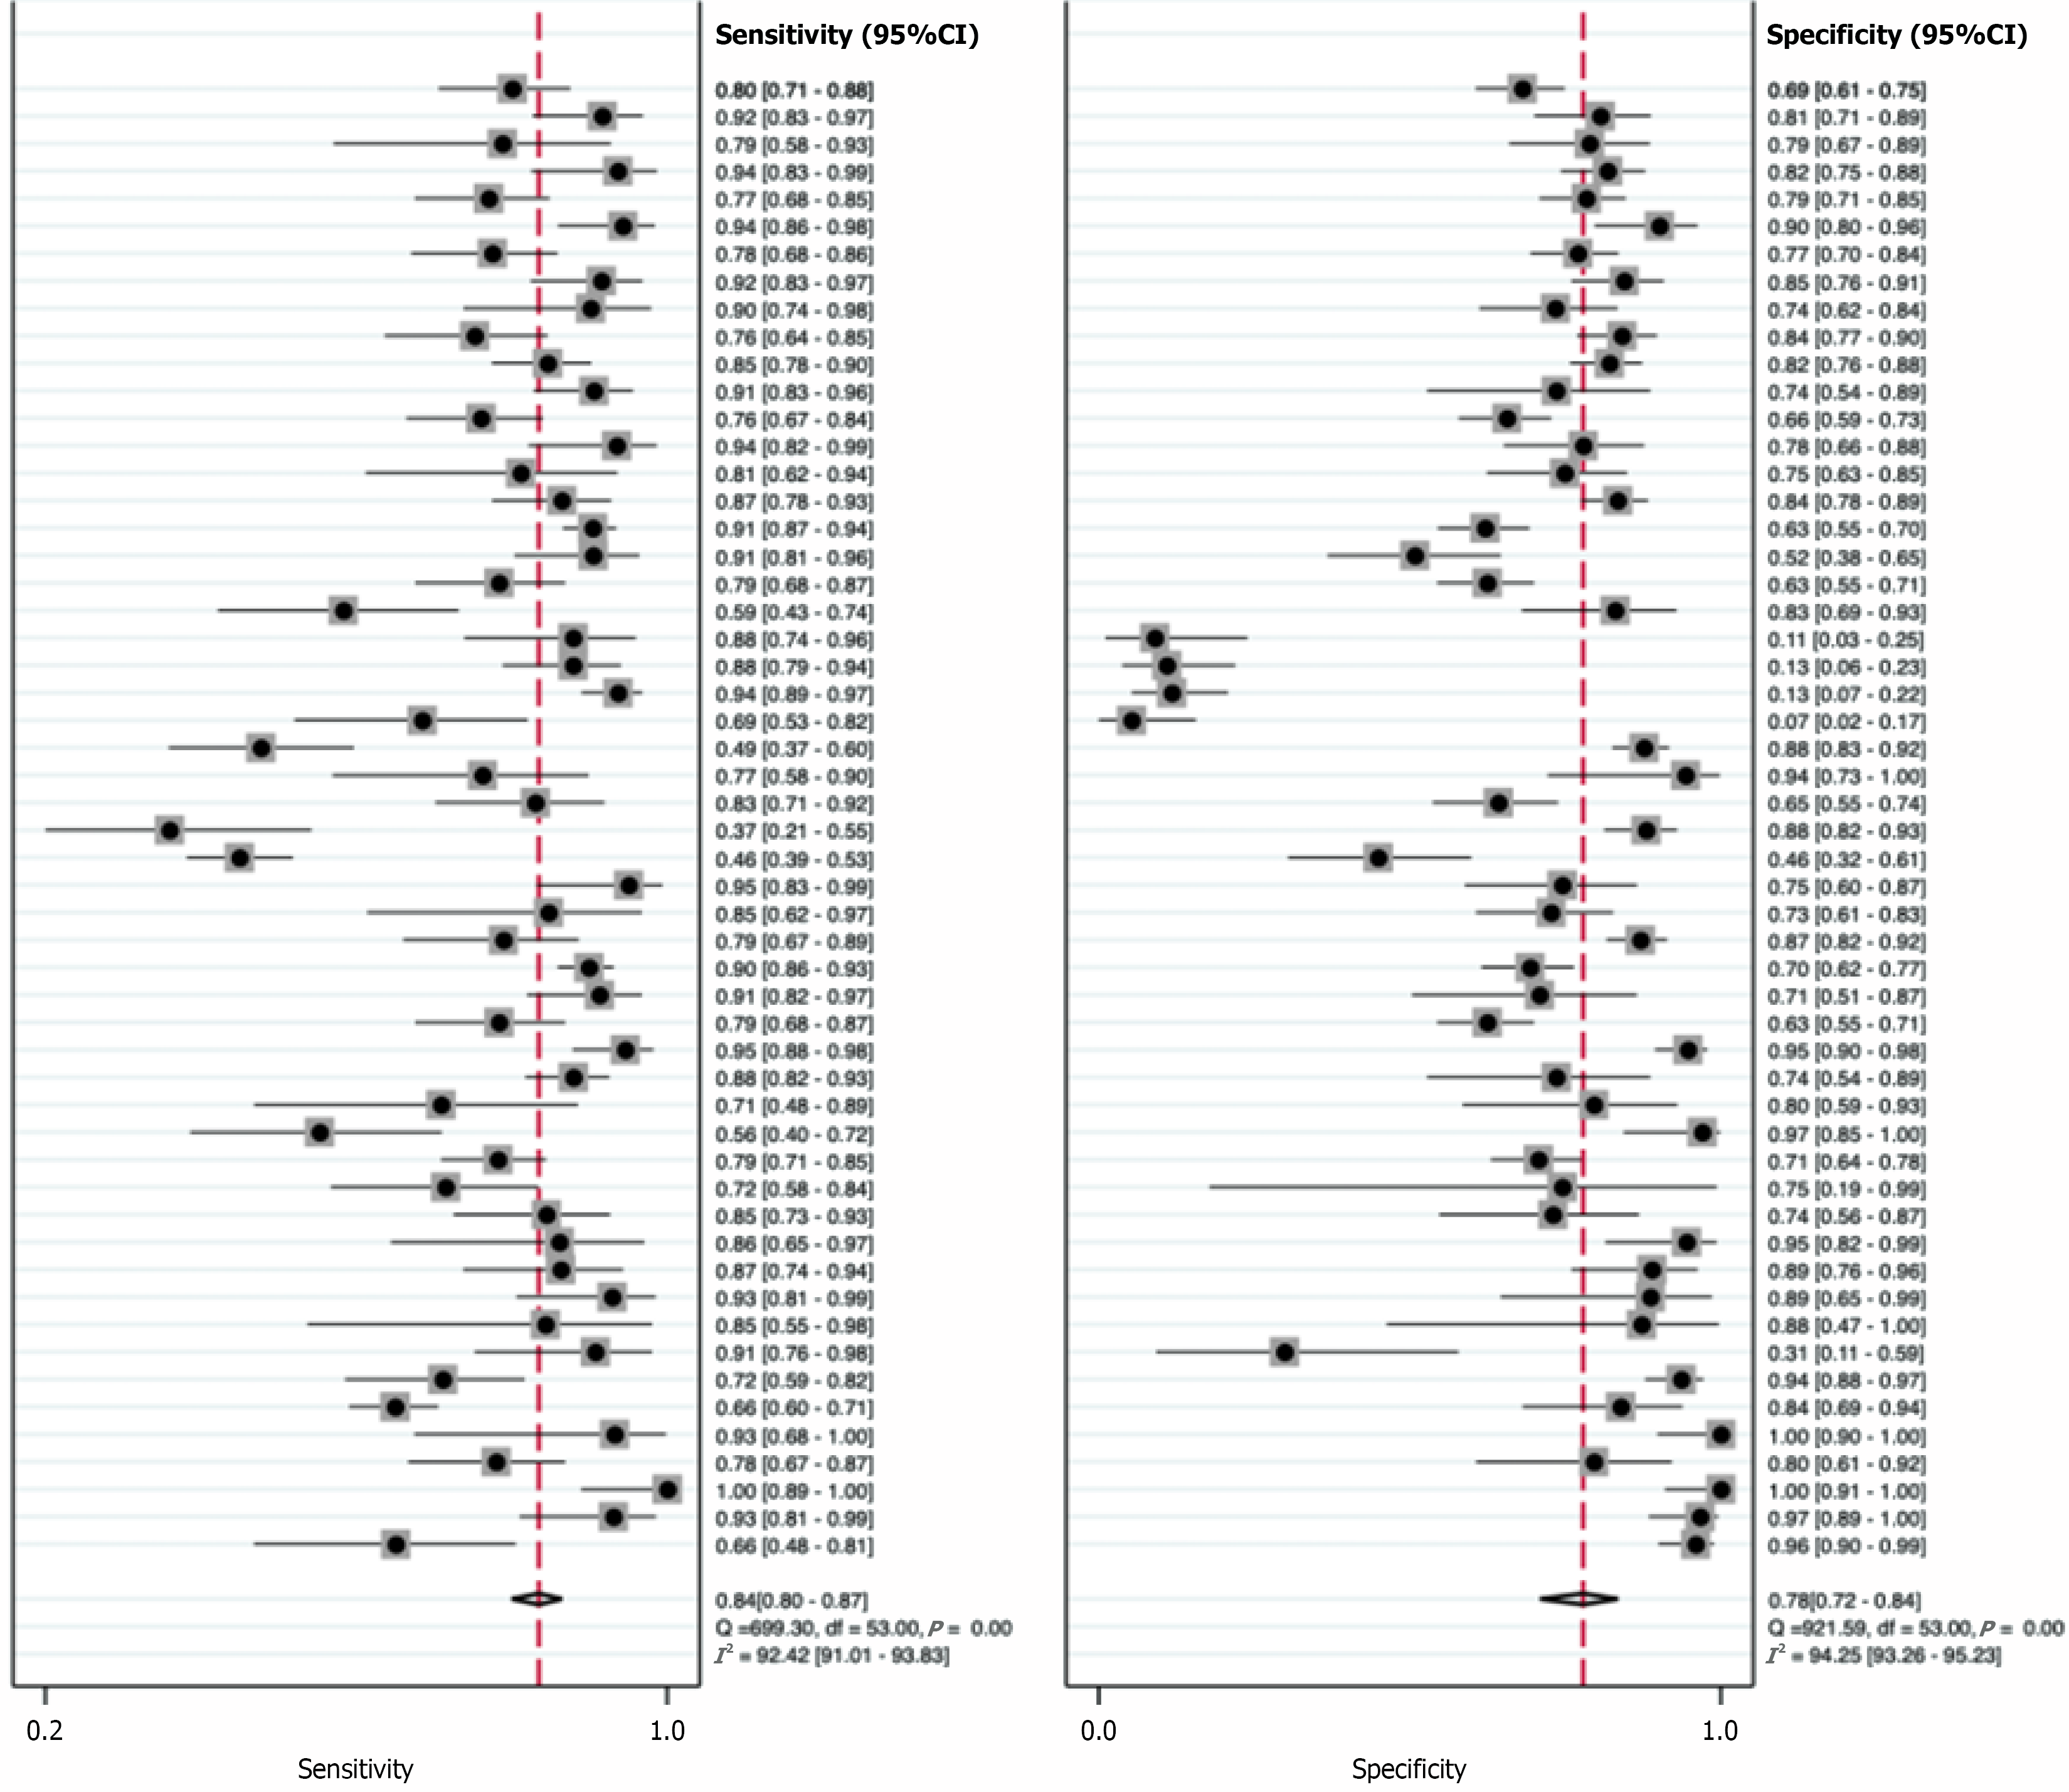
Figure 2 Coupled forest plot of eligible studies.
This plot illustrates the estimated sensitivities and specificities of the studies included in the meta-analysis. The horizontal bars denote the 95% confidence intervals for each study, the diamond represents the pooled random-effects rate, and the vertical line represents the line of no effect. CI: Confidence interval.
- Citation: Zhong SY, Deng XR, Han BC, Yang LQ, Ye ST, Niu XK. Diagnostic performance of magnetic resonance imaging-based radiomics for detecting prostate cancer: A systematic review and meta-analysis. World J Radiol 2026; 18(3): 116826
- URL: https://www.wjgnet.com/1949-8470/full/v18/i3/116826.htm
- DOI: https://dx.doi.org/10.4329/wjr.v18.i3.116826