
















Copyright: ©Author(s) 2026.
World J Radiol. Mar 28, 2026; 18(3): 116736
Published online Mar 28, 2026. doi: 10.4329/wjr.v18.i3.116736
Published online Mar 28, 2026. doi: 10.4329/wjr.v18.i3.116736
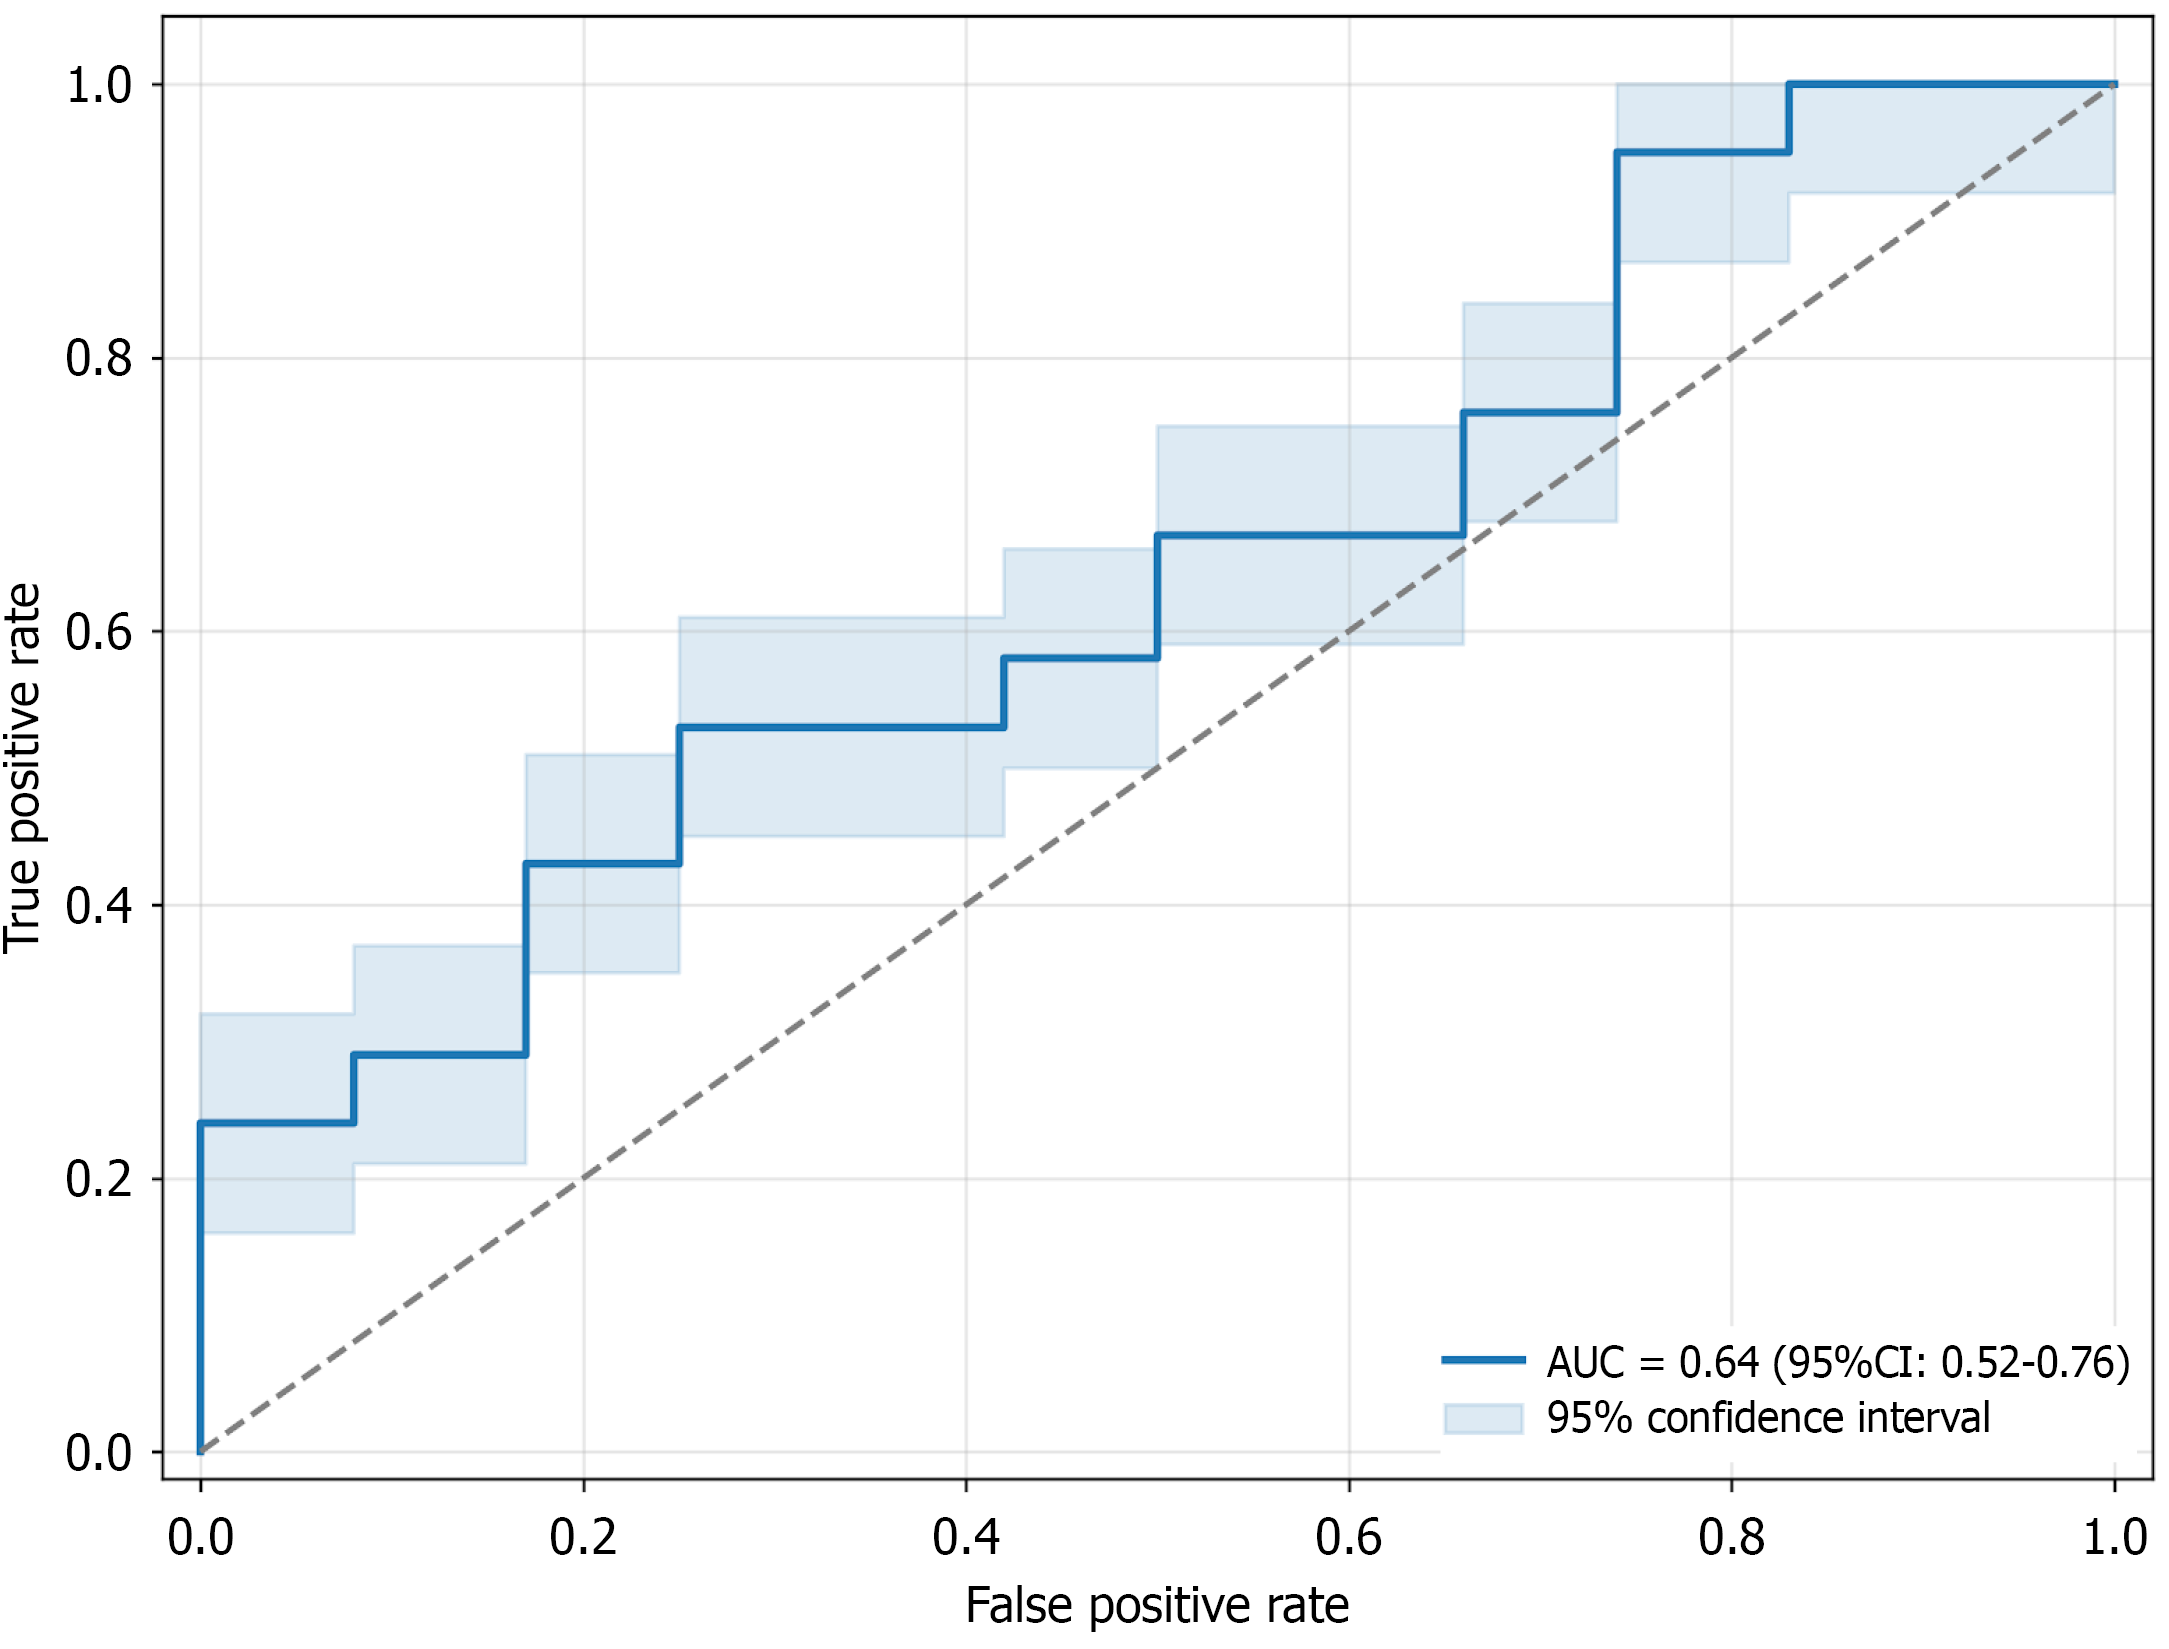
Figure 2 Receiver operating characteristic curve for logistic regression model predicting postoperative thermography normalization.
The model includes age, sex, diagnosis, procedure type, and multilevel disease as predictors. The model consists of age, sex, diagnosis, procedure type, and multilevel disease as predictors. The area under the curve is 0.64, 95% confidence interval: 0.52-0.76, indicating moderate discriminative ability to distinguish between patients with and without thermal normalization following spine surgery. AUC: Area under the curve; CI: Confidence interval.
- Citation: Muthu S, Natarajan KP, Viswanathan VK, Kolarpatti Ponnusamy DV, Satish Kumar RC, Sharun K, Jang HJ. Infrared thermography as adjunctive imaging in spine surgery: Evaluating thermal asymmetry for predicting symptomatic level and recovery. World J Radiol 2026; 18(3): 116736
- URL: https://www.wjgnet.com/1949-8470/full/v18/i3/116736.htm
- DOI: https://dx.doi.org/10.4329/wjr.v18.i3.116736