
















©Author(s) (or their employer(s)) 2026.
World J Radiol. Feb 28, 2026; 18(2): 116973
Published online Feb 28, 2026. doi: 10.4329/wjr.v18.i2.116973
Published online Feb 28, 2026. doi: 10.4329/wjr.v18.i2.116973
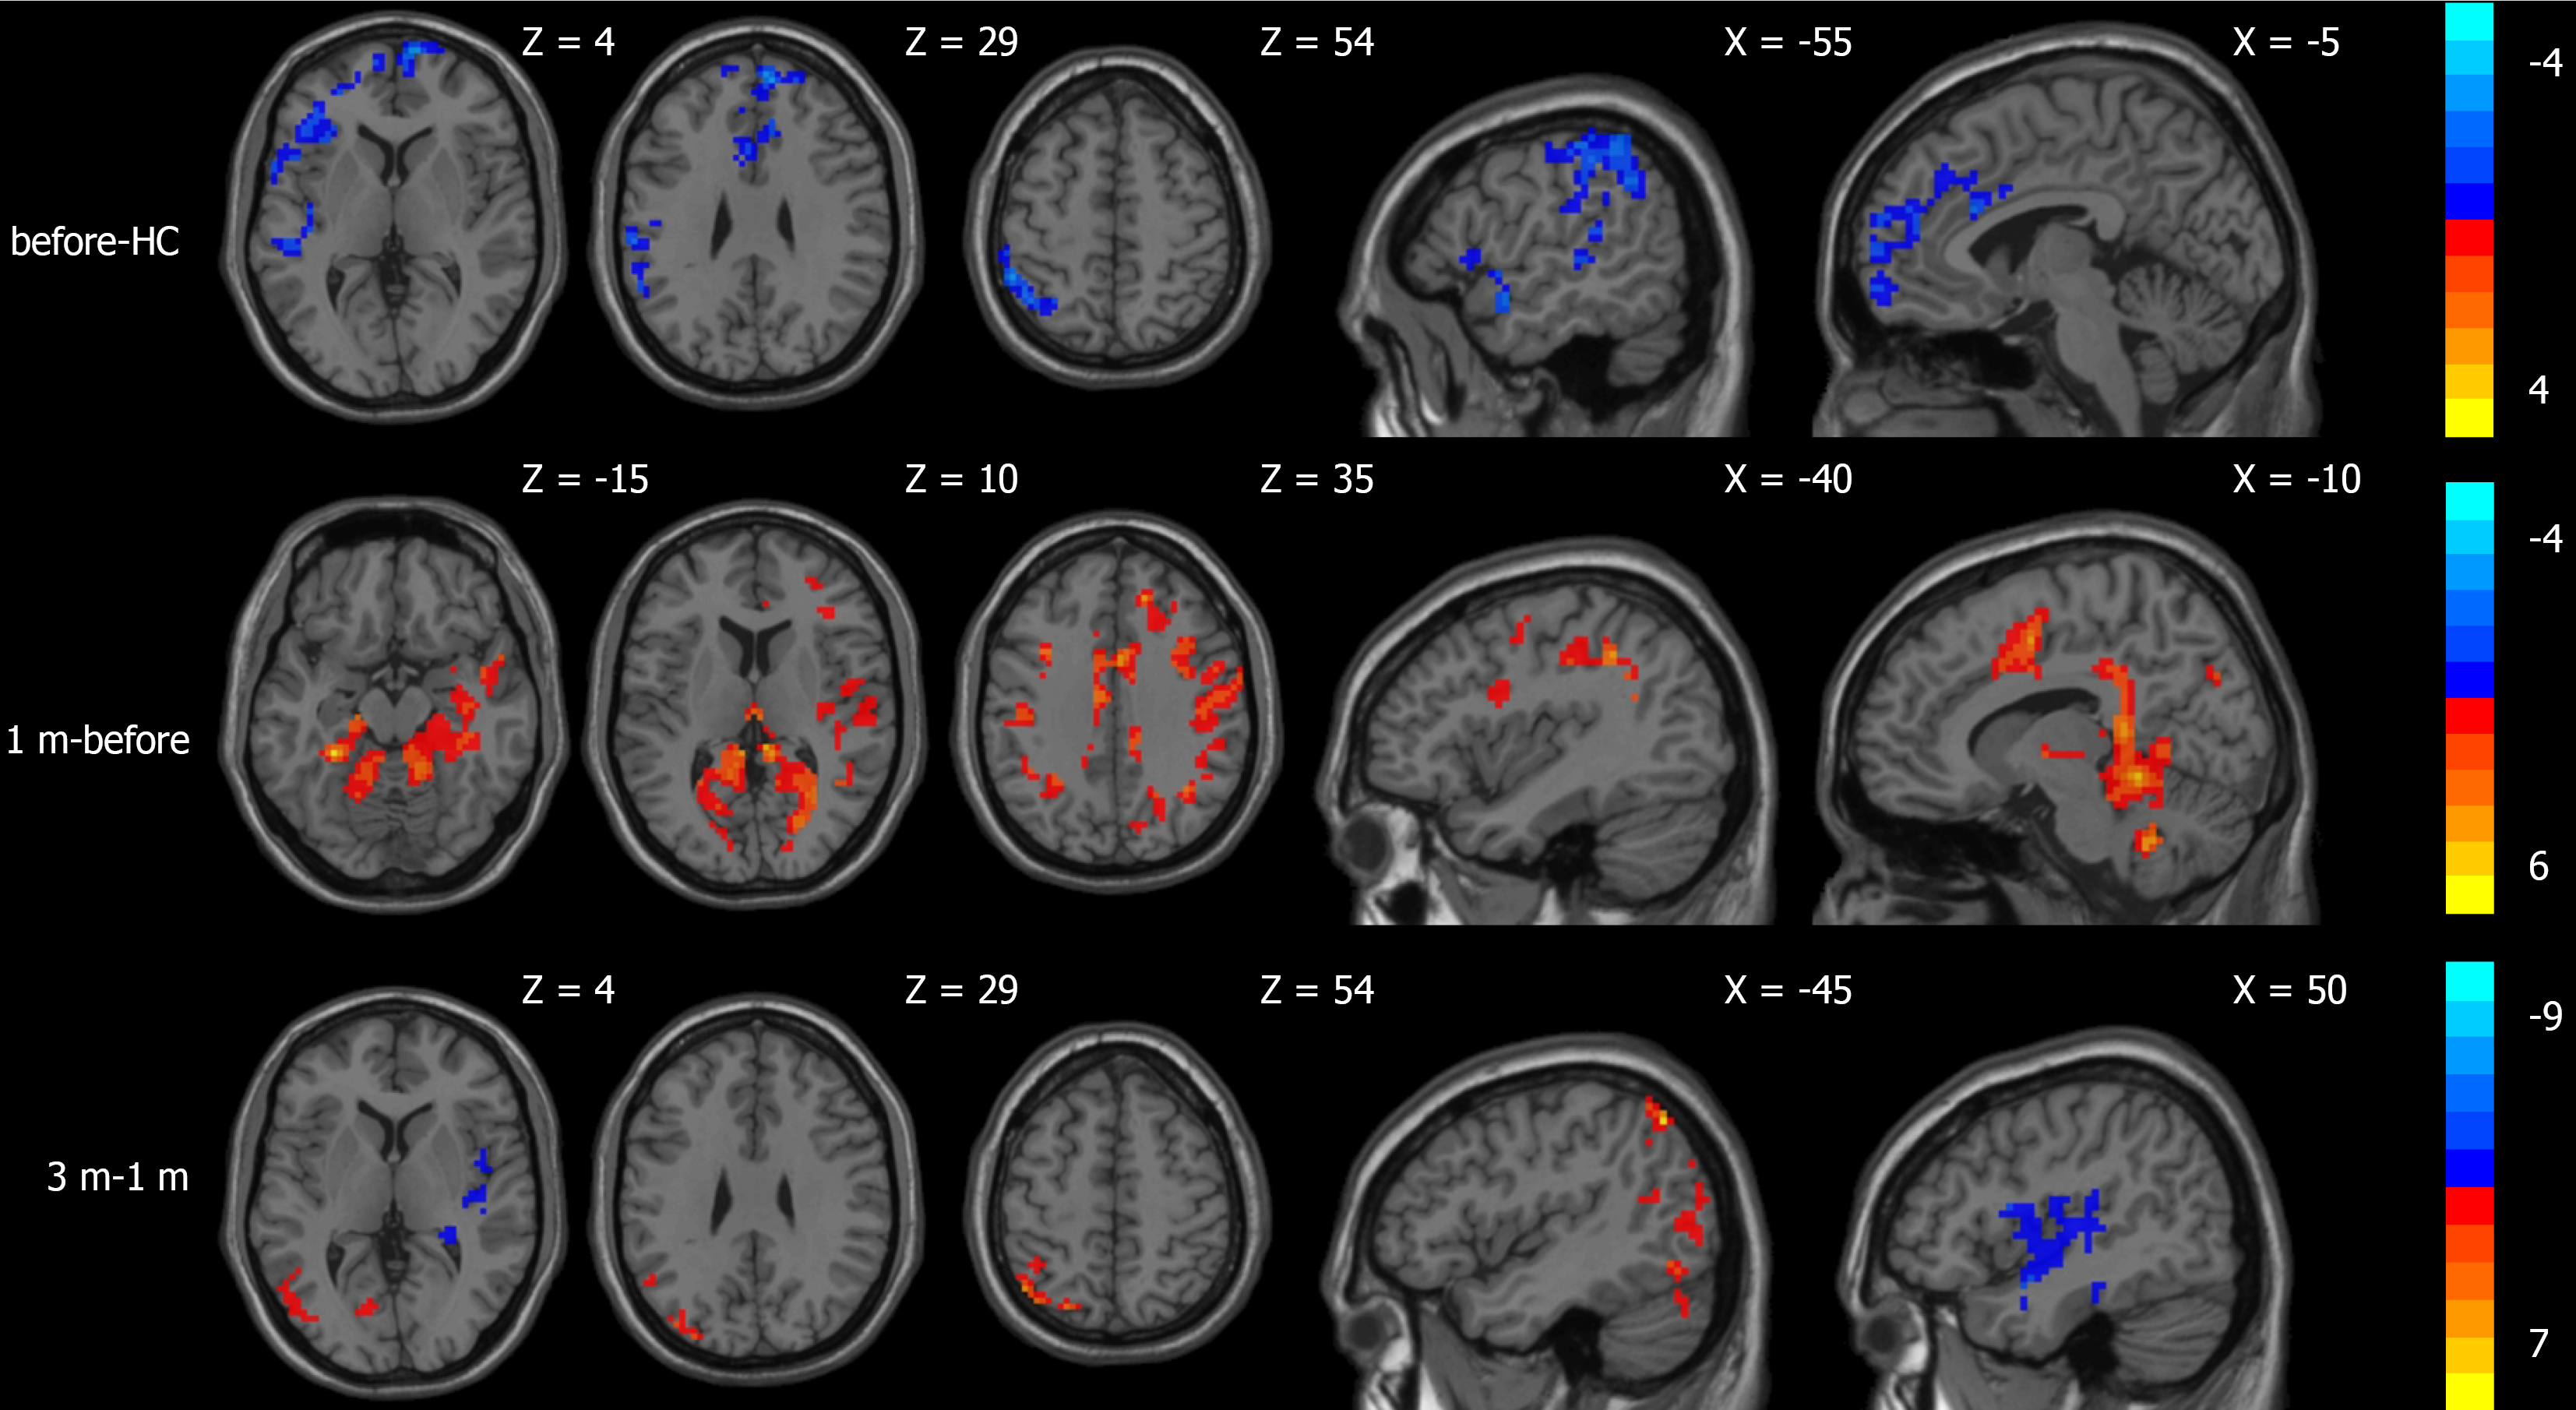
Figure 2 Regions with significant differences showing cerebral blood flow.
The color bar represents the t-values between the two groups after post hoc verification; the higher the brightness of the color, the more significant the difference. The red area indicates regions where amplitude of low-frequency fluctuation values is increased, and the blue area indicates regions where amplitude of low-frequency fluctuation values is decreased. X and Z = three-dimensional coordinates of brain structures. Before: Preoperative transjugular intrahepatic portosystemic shunts; HC: Healthy control group; 1 m: Postoperative transjugular intrahepatic portosystemic shunts at 1 month; 3 m: Postoperative transjugular intrahepatic portosystemic shunts at 3 months.
- Citation: Zhuang WL, Xu SW, Fang J, Zhang ZQ, Zhang SA, Wang JL, Zheng JL, Wang XY, Li DL. Role of cerebral blood flow changes in post-transjugular intrahepatic portosystemic shunts hepatic encephalopathy. World J Radiol 2026; 18(2): 116973
- URL: https://www.wjgnet.com/1949-8470/full/v18/i2/116973.htm
- DOI: https://dx.doi.org/10.4329/wjr.v18.i2.116973