
















©Author(s) (or their employer(s)) 2026.
World J Radiol. Feb 28, 2026; 18(2): 116486
Published online Feb 28, 2026. doi: 10.4329/wjr.v18.i2.116486
Published online Feb 28, 2026. doi: 10.4329/wjr.v18.i2.116486
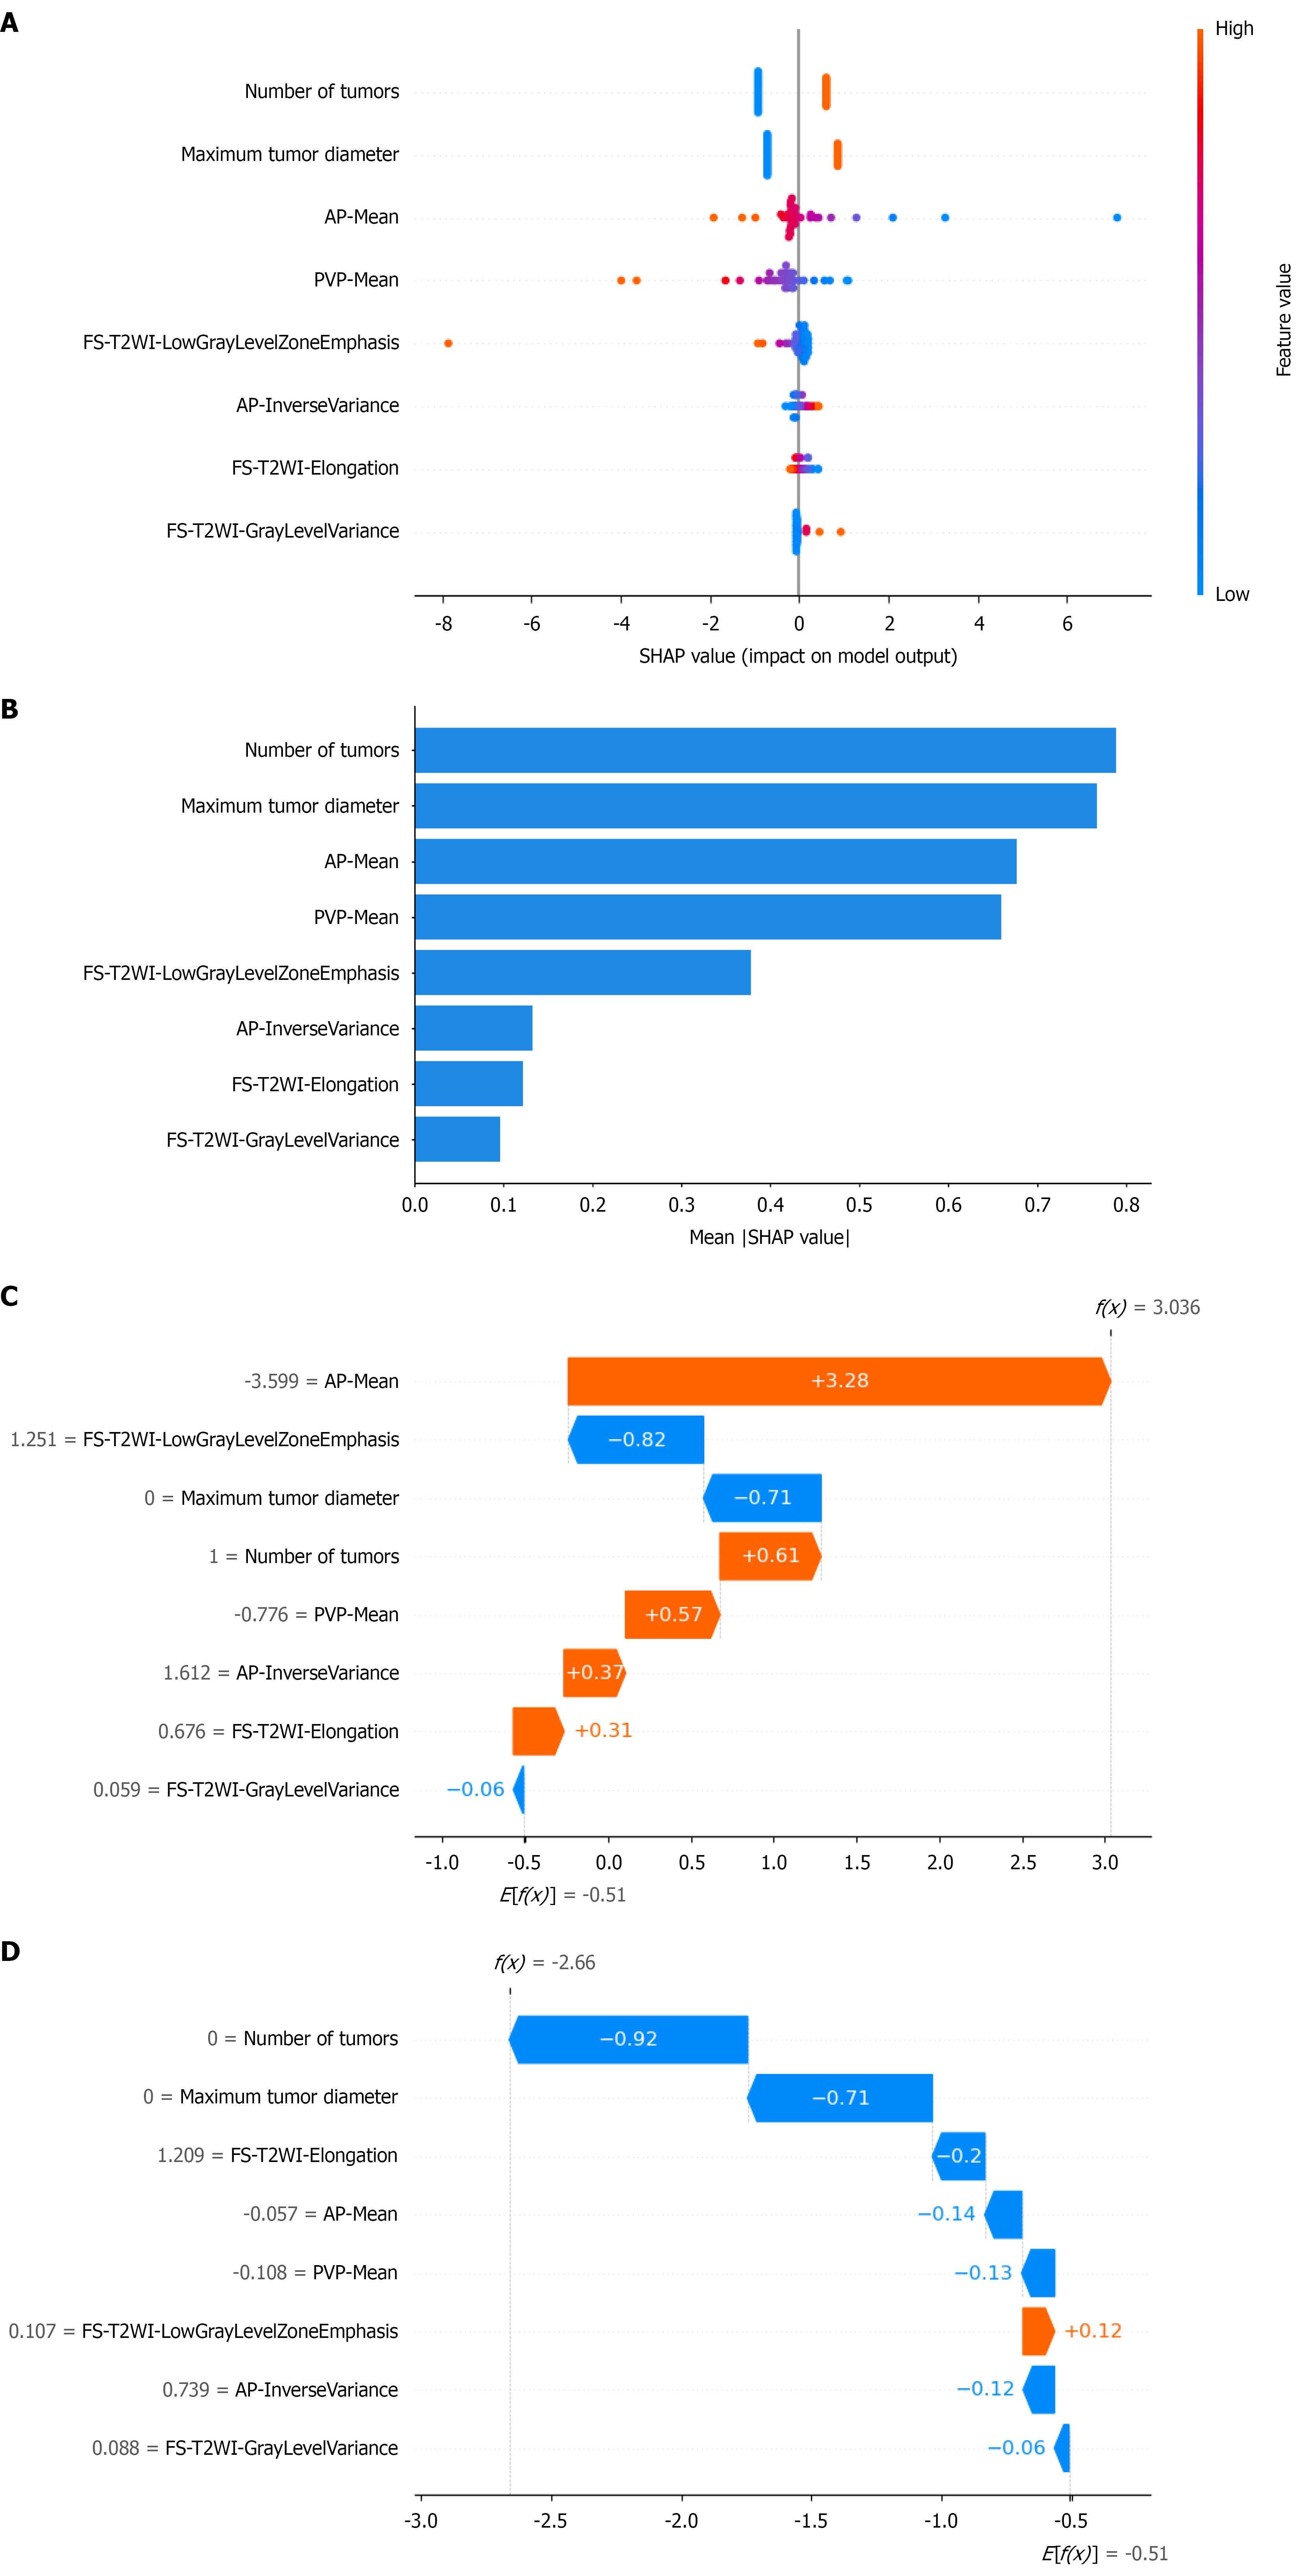
Figure 5 SHapley Additive exPlanations analysis plot of each predictor in the radiomic-clinical model.
A: SHapley Additive exPlanations (SHAP) summary plot shows the distribution of the SHAP values of each predictor in all the samples; B: The SHAP bar plot shows the importance of each predictor in predicting early responses to transarterial chemoembolization (TACE); C: SHAP waterfall plot showing the predicted values for individual samples with the predicted outcome of non-response to TACE; D: SHAP waterfall plot showing the predicted values for individual samples with the predicted outcome of early response to TACE. AP: Arterial phase; PVP: Portal venous phase; FS-T2WI: Fat-saturation T2-weighted imaging; SHAP: SHapley Additive exPlanations.
- Citation: Mao Q, Zhang P, Zhou MT, Shi Y, Min XL, Xu H, Yang L, Zhang XM. Interpretable radiomics model based on magnetic resonance imaging to predict responses to transarterial chemoembolization for hepatocellular carcinoma. World J Radiol 2026; 18(2): 116486
- URL: https://www.wjgnet.com/1949-8470/full/v18/i2/116486.htm
- DOI: https://dx.doi.org/10.4329/wjr.v18.i2.116486