
















©Author(s) (or their employer(s)) 2026.
World J Radiol. Feb 28, 2026; 18(2): 116486
Published online Feb 28, 2026. doi: 10.4329/wjr.v18.i2.116486
Published online Feb 28, 2026. doi: 10.4329/wjr.v18.i2.116486
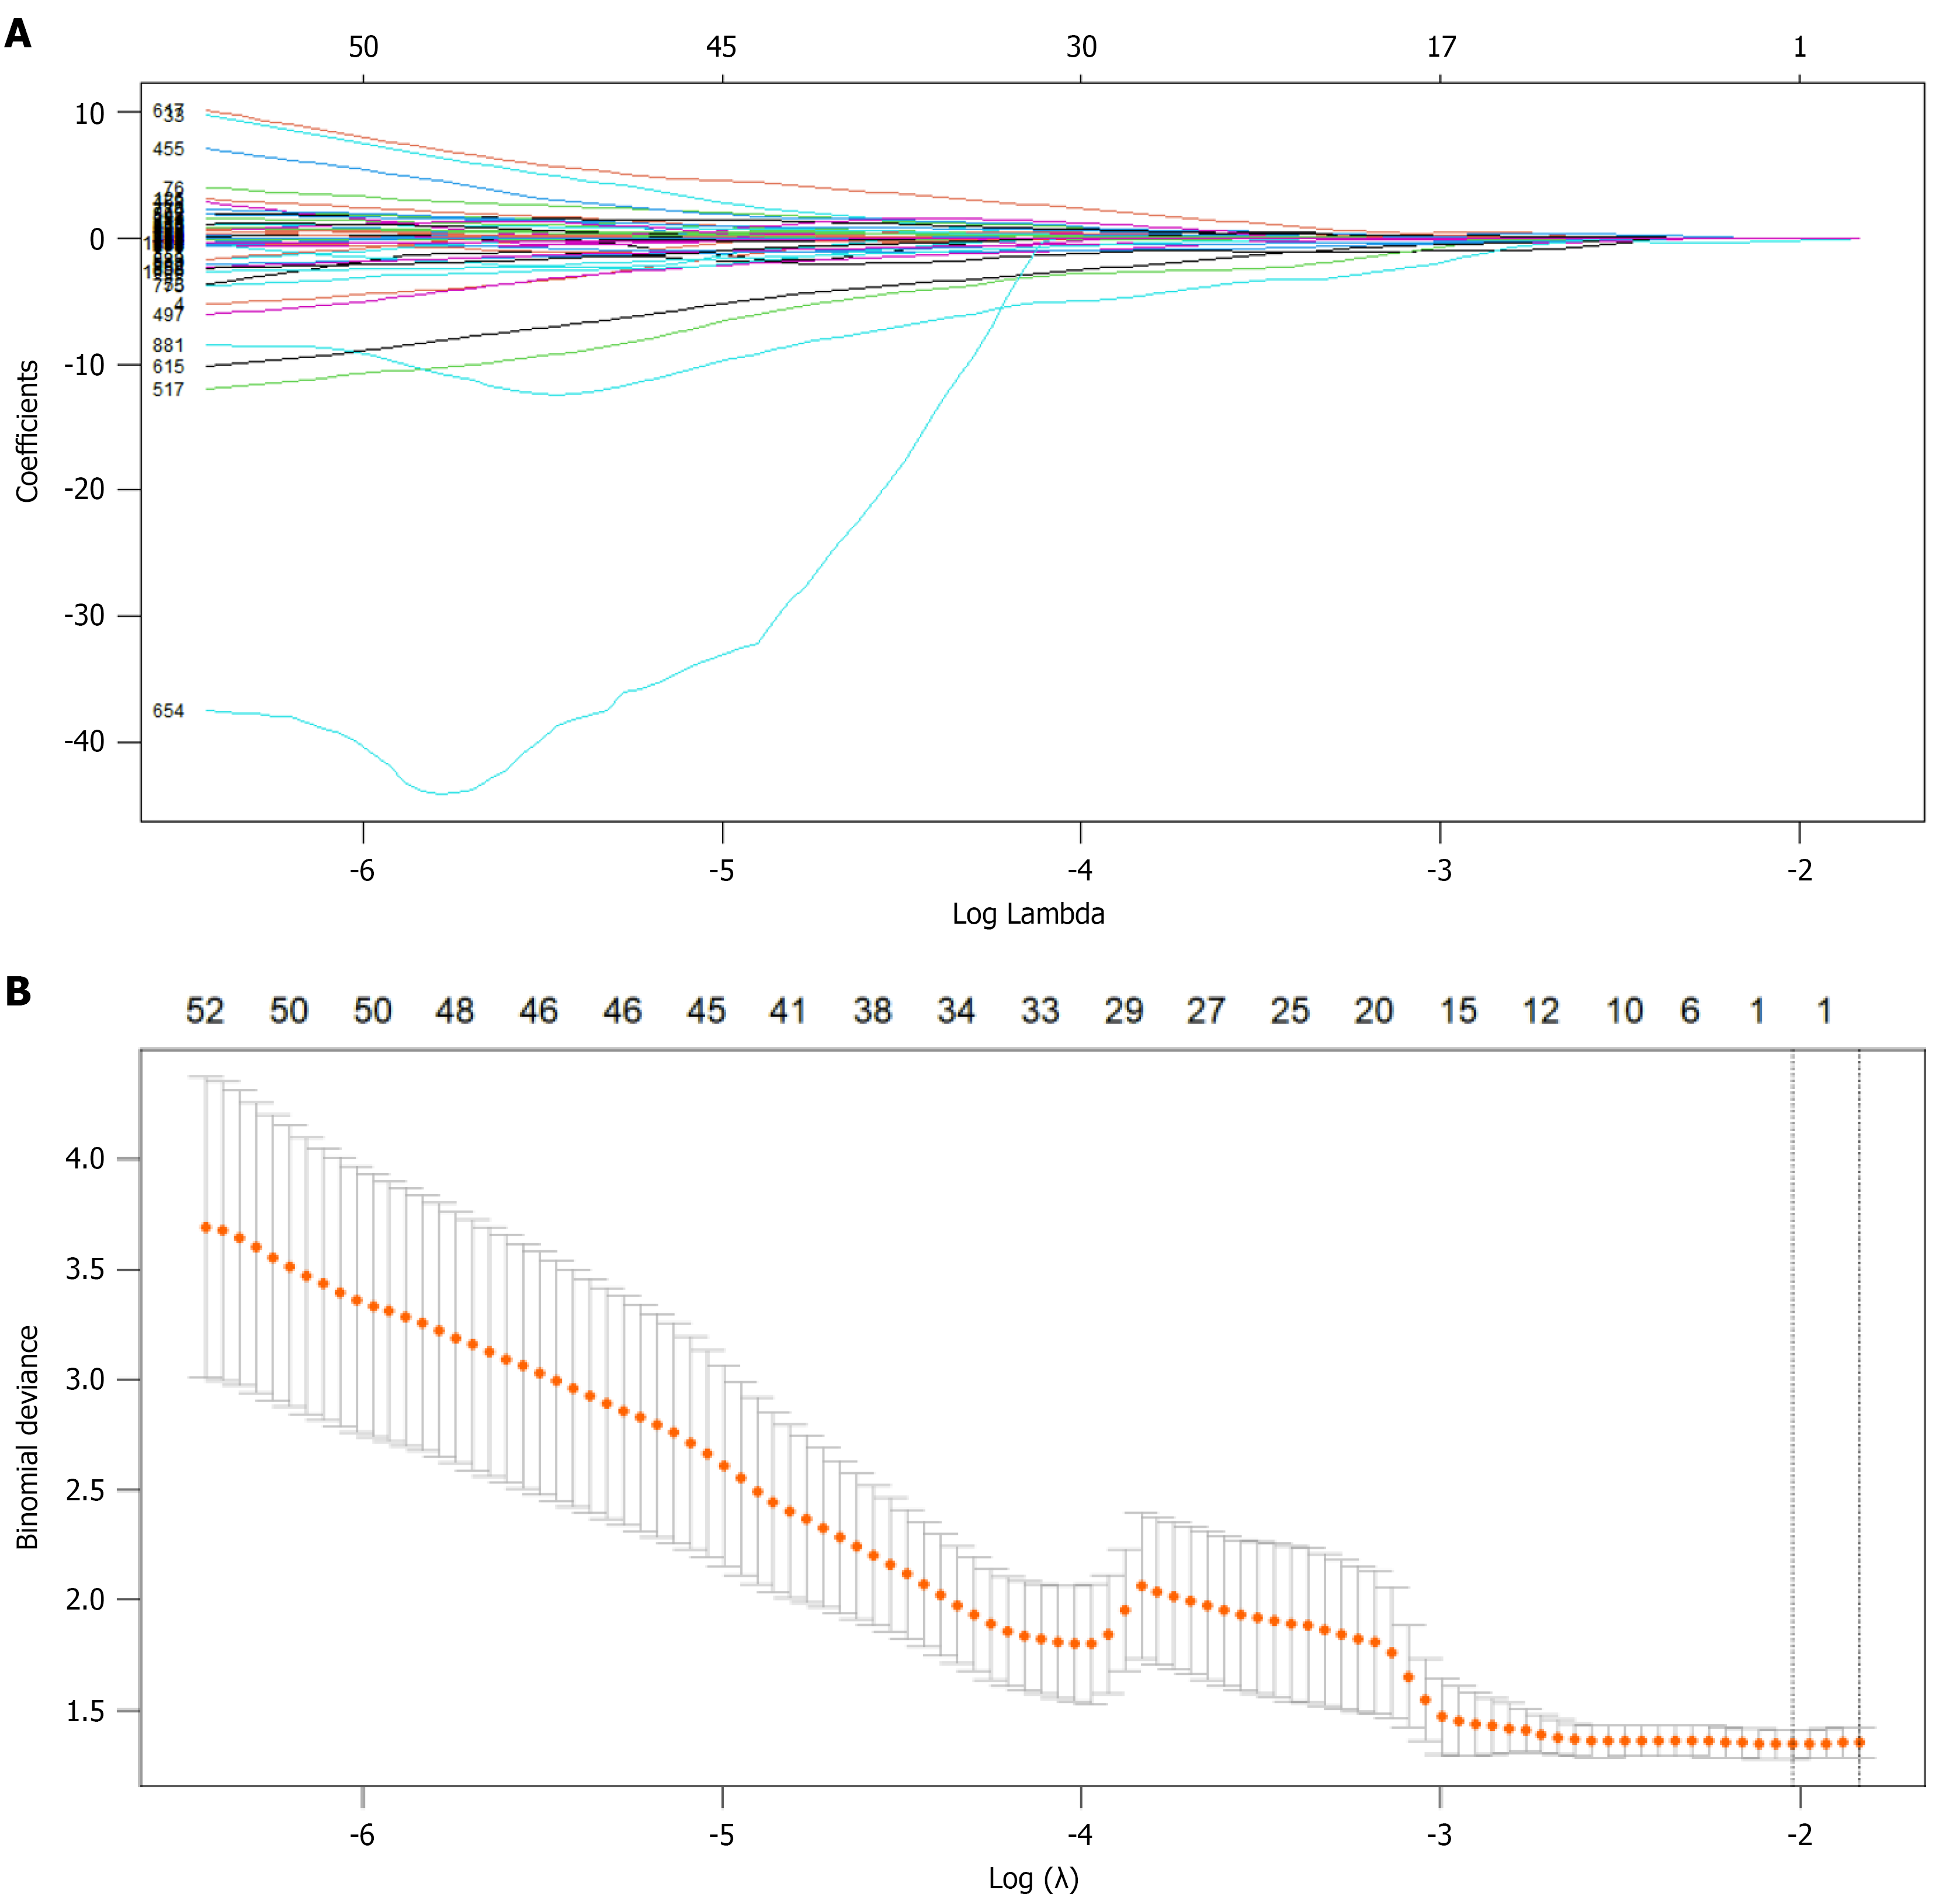
Figure 3 Feature selection via least absolute shrinkage and selection operator regression.
A: Least absolute shrinkage and selection operator regression coefficient path diagram. As the penalty parameter increases, the feature coefficients gradually decrease toward zero. The features with nonzero coefficients at the λ (1-standard error) line were ultimately selected, resulting in 3, 2, and 1 optimal feature from the features of the fat-saturation T2-weighted imaging, arterial phase, and portal venous phase datasets for subsequent model construction; B: Least absolute shrinkage and selection operator regression parameter diagram. The two vertical dashed lines indicate the selected values using cross-validation: The optimal value was obtained by applying the minimum criteria and 1 of the minimum criteria (1-standard error criteria).
- Citation: Mao Q, Zhang P, Zhou MT, Shi Y, Min XL, Xu H, Yang L, Zhang XM. Interpretable radiomics model based on magnetic resonance imaging to predict responses to transarterial chemoembolization for hepatocellular carcinoma. World J Radiol 2026; 18(2): 116486
- URL: https://www.wjgnet.com/1949-8470/full/v18/i2/116486.htm
- DOI: https://dx.doi.org/10.4329/wjr.v18.i2.116486