
















©Author(s) (or their employer(s)) 2026.
World J Radiol. Feb 28, 2026; 18(2): 116462
Published online Feb 28, 2026. doi: 10.4329/wjr.v18.i2.116462
Published online Feb 28, 2026. doi: 10.4329/wjr.v18.i2.116462
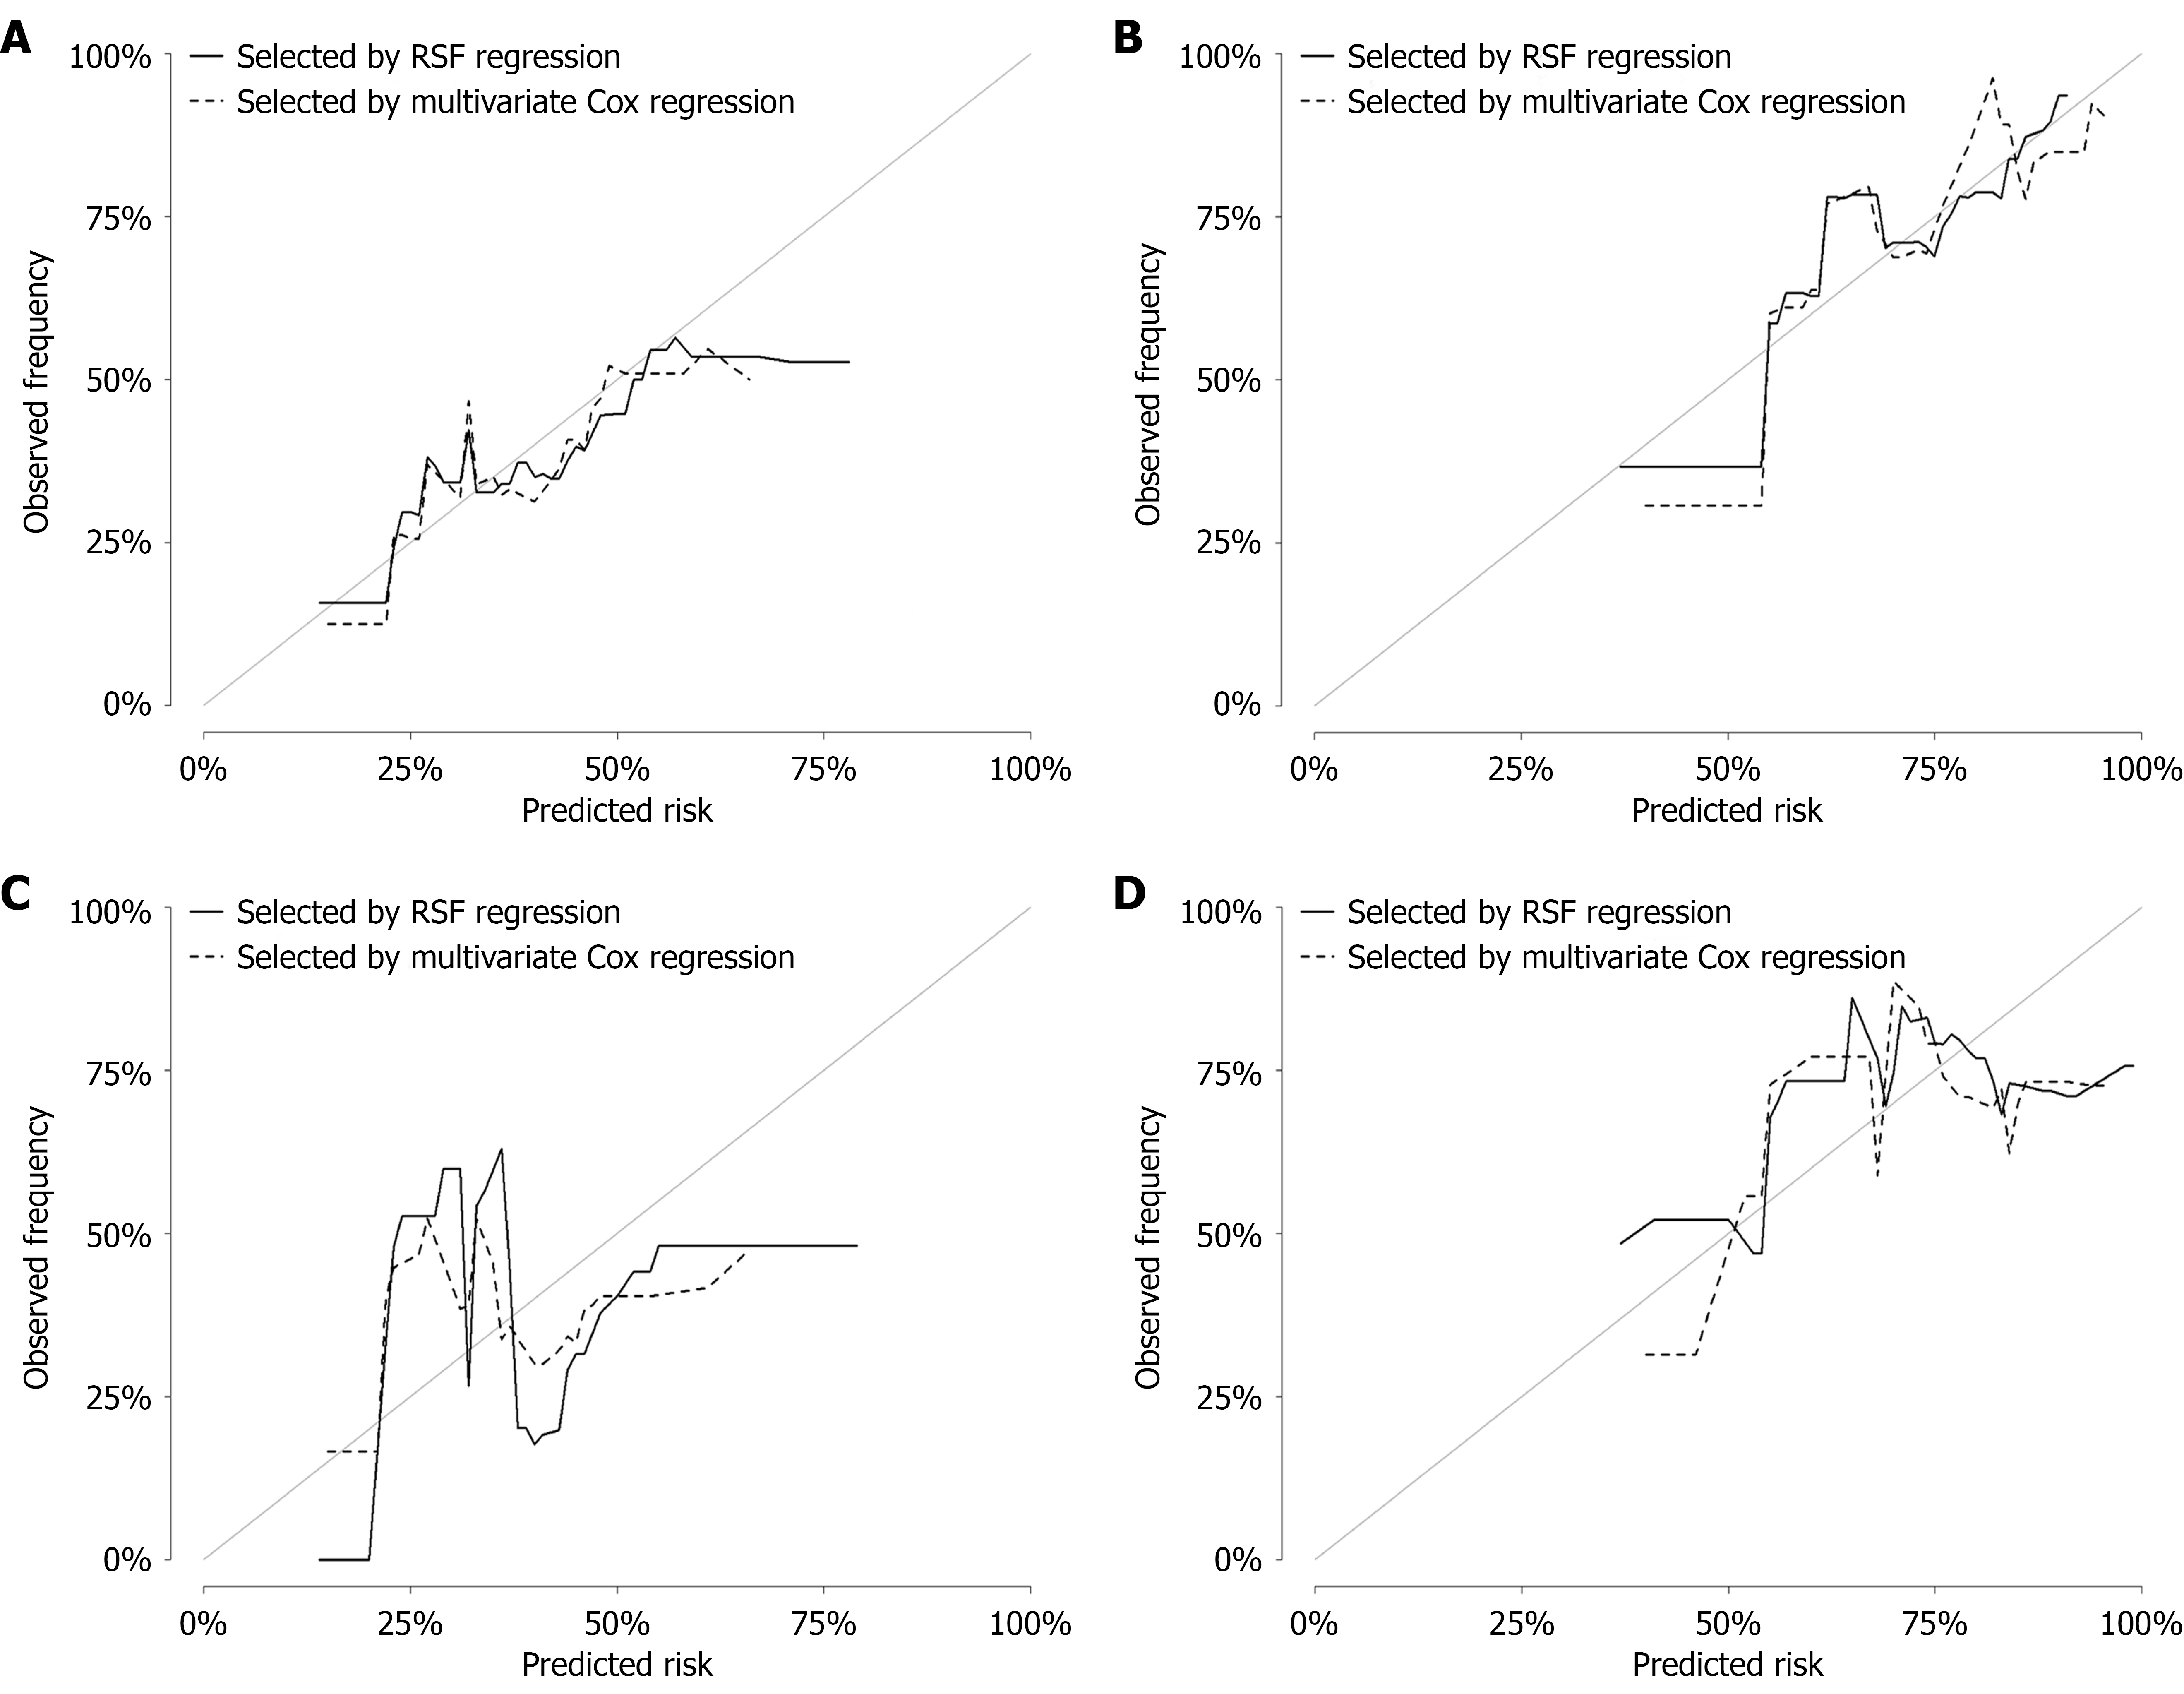
Figure 4 Calibration curves for the nomogram presenting agreement between predicted and observational survival probabilities of overall survival for patients with soft-tissue sarcomas receiving surgical resection.
The gray line of Y = X represents a perfect predictive power by an ideal model. The fit goodness with this diagonal line coincided with the model’s predictive performance. A: Calibration plot for comparison between nomogram predicted 3-year survival rates and actual observation for overall survival (OS) in the training cohort; B: Calibration plot for comparison between nomogram predicted 5-year survival rates and actual observation for OS in the training cohort; C: Calibration plot for comparison between nomogram predicted 3-year survival rates and actual observation for OS in the testing cohort; D: Calibration plot for comparison between nomogram predicted 5-year survival rates and actual observation for OS in the testing cohort. RSF: Random survival forest.
- Citation: Yang YH. Computed tomography-based nutritional associated nomogram on machine learning predicts survival outcomes in patients with resectable soft-tissue sarcoma. World J Radiol 2026; 18(2): 116462
- URL: https://www.wjgnet.com/1949-8470/full/v18/i2/116462.htm
- DOI: https://dx.doi.org/10.4329/wjr.v18.i2.116462