
















©Author(s) (or their employer(s)) 2026.
World J Radiol. Feb 28, 2026; 18(2): 116462
Published online Feb 28, 2026. doi: 10.4329/wjr.v18.i2.116462
Published online Feb 28, 2026. doi: 10.4329/wjr.v18.i2.116462
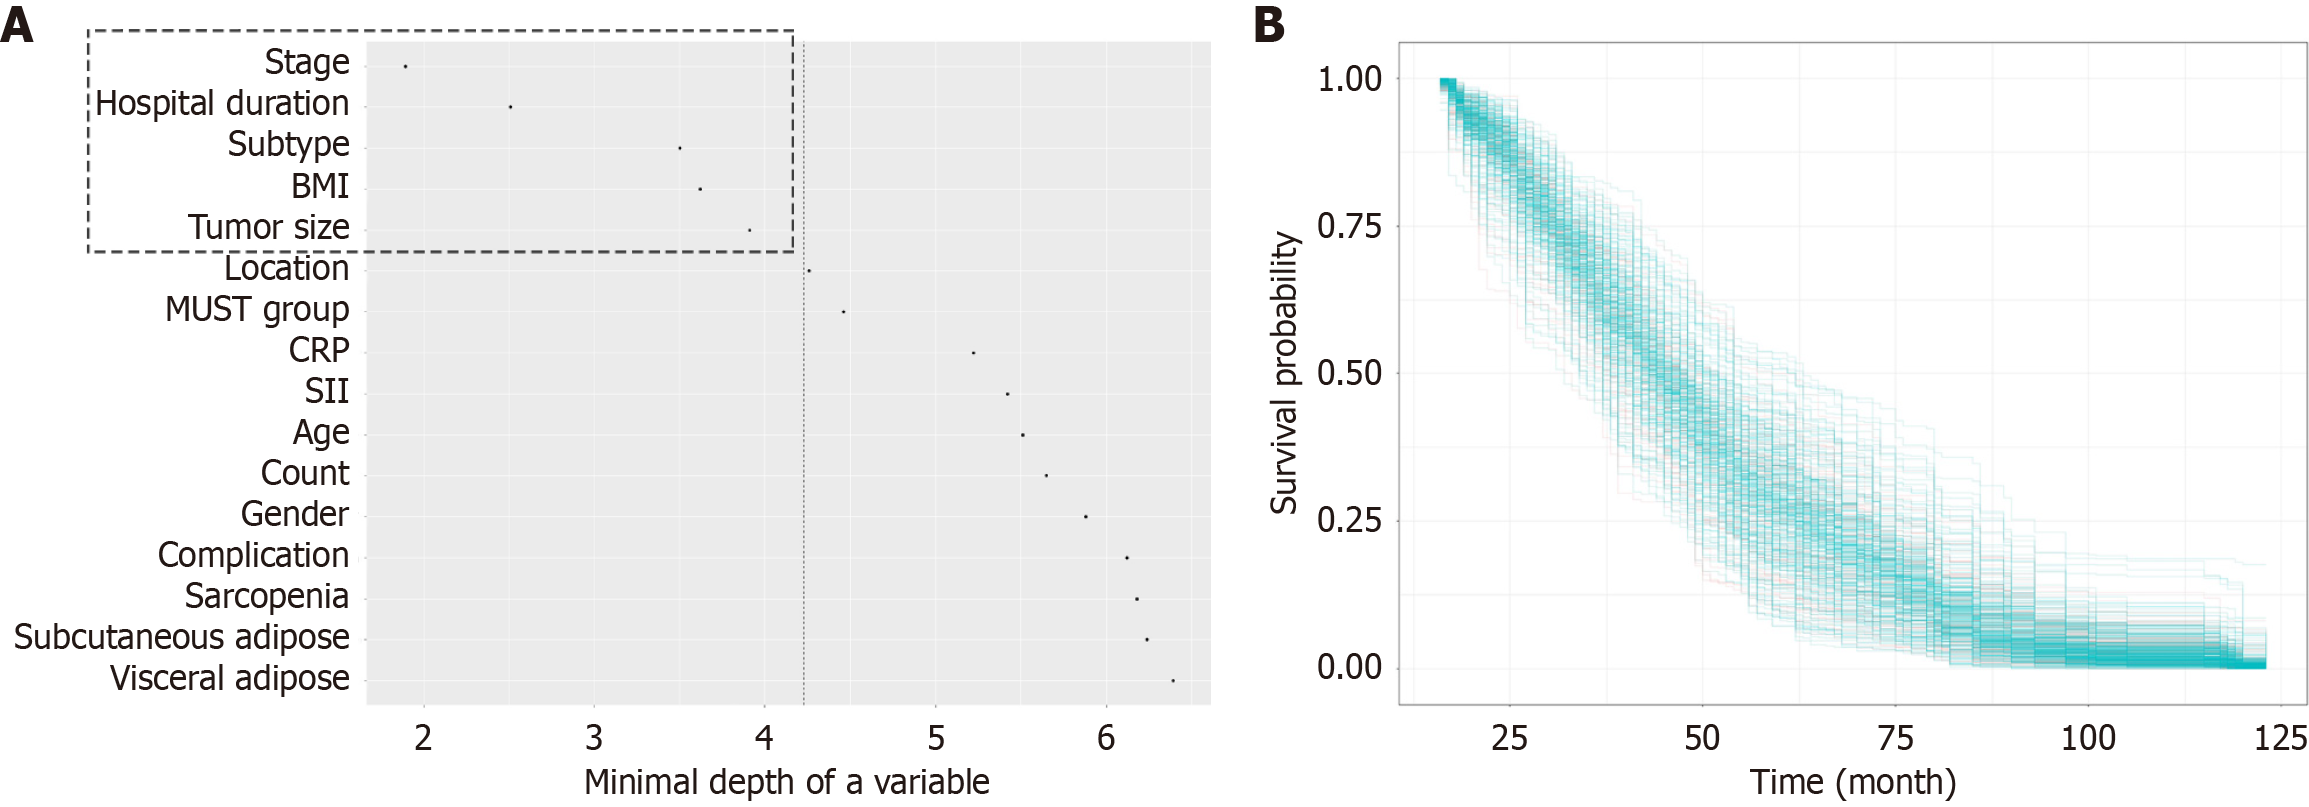
Figure 2 Visualization of random survival forest analysis results for overall survival in the training cohort.
A: Variable ranking with minimal depth method of random survival forest analysis on overall survival (OS) in the training cohort. The variables in the dashed box were identified as important for OS prediction. The dashed vertical line was the optimistic threshold using the mean of the minimal depth distribution which classified variables with minimal depth lower than this threshold as important in prediction of outcomes; B: Random forest predicted survival for each patient in the training cohort on OS. The lines with dark grey corresponded to censored individuals, and light grey curves corresponded to individuals occurring death events. BMI: Body mass index; CRP: C-reactive protein; MUST: Malnutrition universal screening tool.
- Citation: Yang YH. Computed tomography-based nutritional associated nomogram on machine learning predicts survival outcomes in patients with resectable soft-tissue sarcoma. World J Radiol 2026; 18(2): 116462
- URL: https://www.wjgnet.com/1949-8470/full/v18/i2/116462.htm
- DOI: https://dx.doi.org/10.4329/wjr.v18.i2.116462