
















©Author(s) (or their employer(s)) 2026.
World J Radiol. Feb 28, 2026; 18(2): 116462
Published online Feb 28, 2026. doi: 10.4329/wjr.v18.i2.116462
Published online Feb 28, 2026. doi: 10.4329/wjr.v18.i2.116462
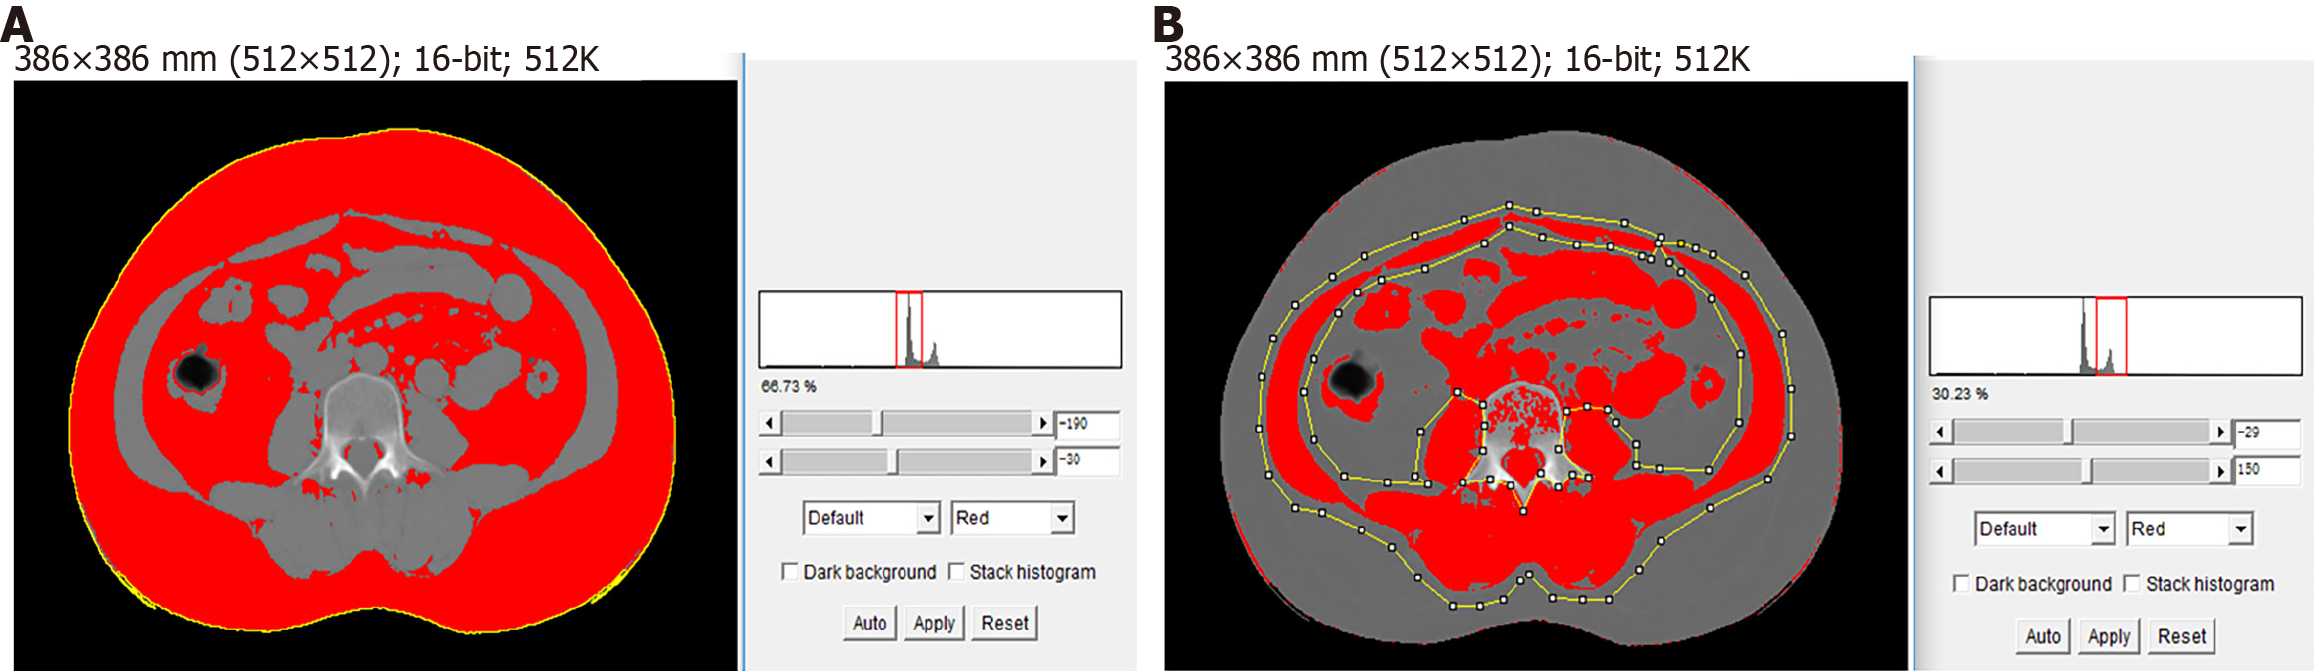
Figure 1 The picture from ImageJ to draw the outlines of total adipose tissue.
The white region fitted with the setting standard Hounsfield unit range of adipose tissue (-190 to -30) or skeletal muscle (-29 to +150). The white line depicted the boundaries of regions which would be measured by area (cm2). A: Area and skeletal muscle area; B: On the computed tomography image of 3rd lumbar vertebra.
- Citation: Yang YH. Computed tomography-based nutritional associated nomogram on machine learning predicts survival outcomes in patients with resectable soft-tissue sarcoma. World J Radiol 2026; 18(2): 116462
- URL: https://www.wjgnet.com/1949-8470/full/v18/i2/116462.htm
- DOI: https://dx.doi.org/10.4329/wjr.v18.i2.116462