
















Copyright: ©Author(s) 2026.
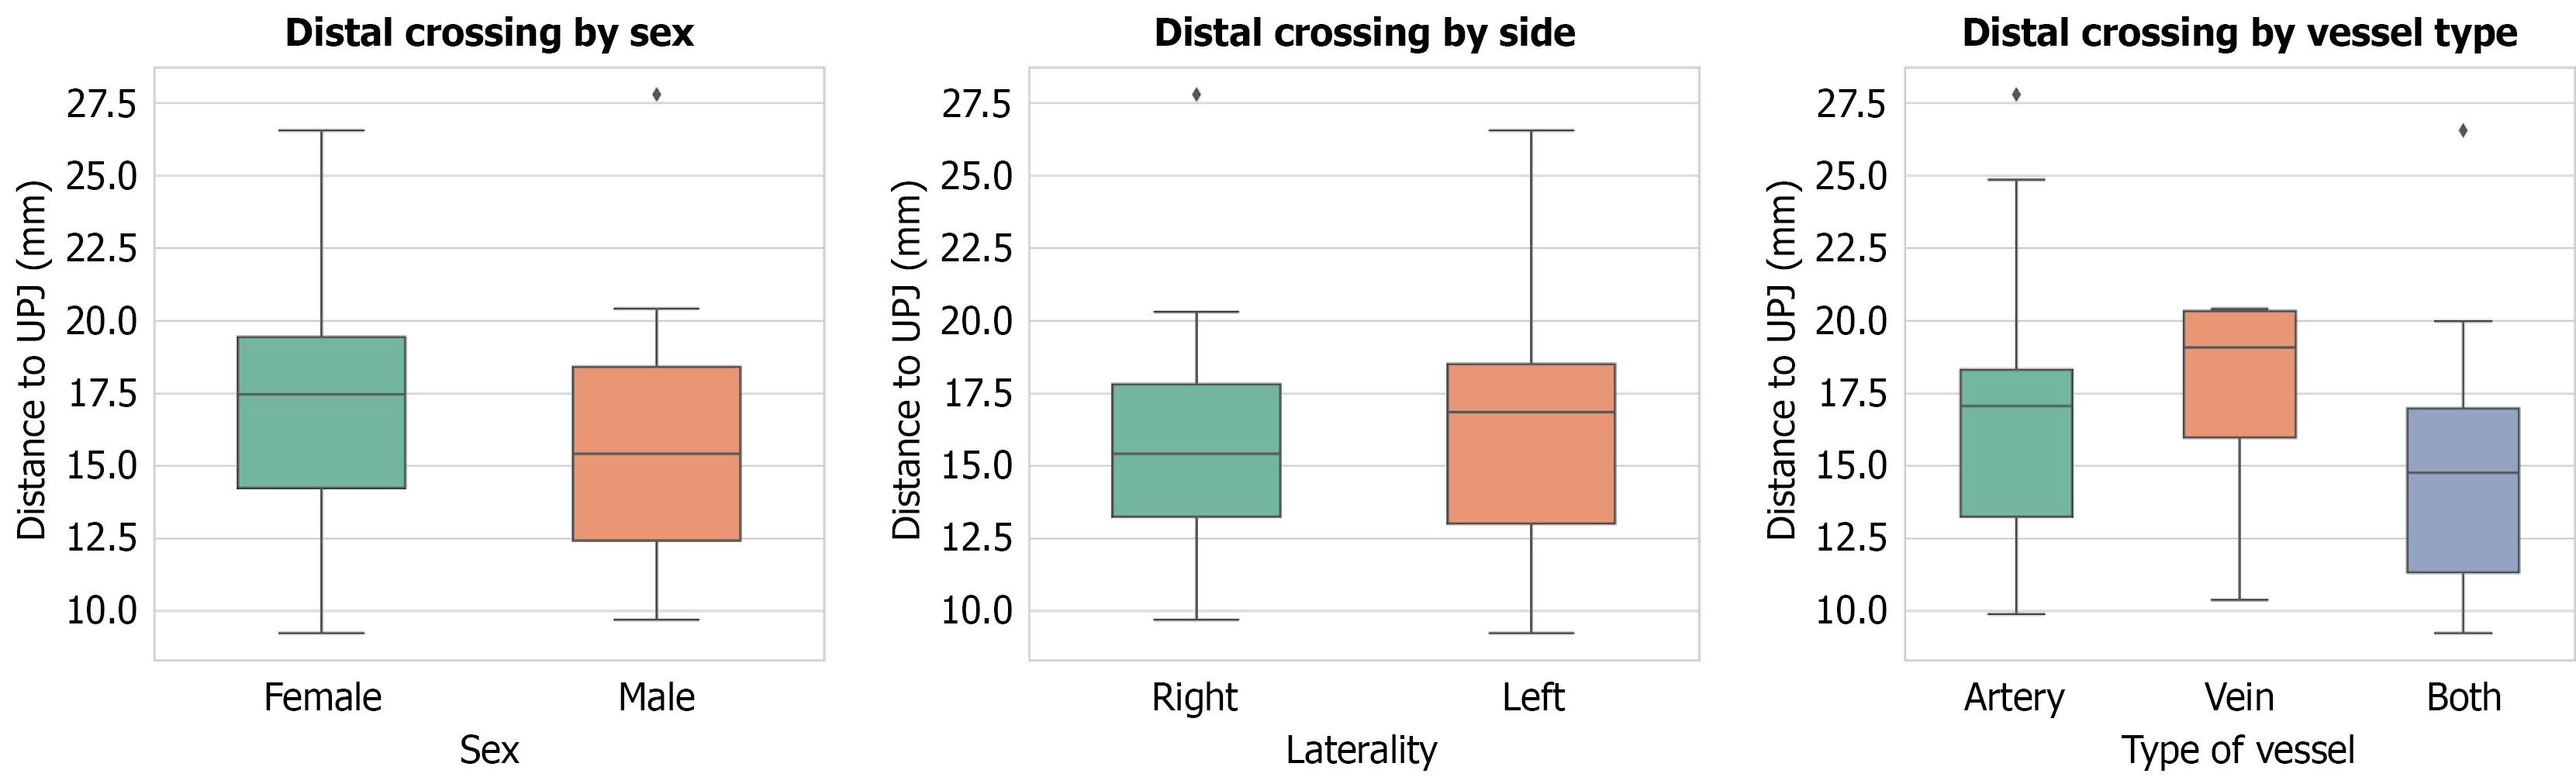
Figure 6 Box plots demonstrating the distal site of crossing (> 0 mm) between the vessel and the ureteropelvic junction, categorized by patient sex.
Left: Female (n = 17), male (n = 39), laterality [center: Left (n = 31), right (n = 25)], and vascular etiology [right: Artery (n = 36), vein (n = 6), both (n = 14)]. The central horizontal line within each box represents the median distance, while the lower and upper boundaries of the box indicate the first and third quartiles (interquartile range). The whiskers extend to the lowest and highest values within 1.5 times the interquartile range. Diamond markers denote outlier data points beyond this range.
- Citation: Paschopoulos I, Triantafyllou G, Gondorf D, Arkoudis NA, Velonakis G, Mariorakis C, Lyrtzis C, Gyftopoulos K, Piagkou M. Aberrant renal vessels crossing the ureter and the ureteropelvic junction: A retrospective computed tomography-based analysis of non-obstructed population. World J Radiol 2026; 18(10): 127348
- URL: https://www.wjgnet.com/1949-8470/full/v18/i10/127348.htm
- DOI: https://dx.doi.org/10.4329/wjr.127348