
















Copyright: ©Author(s) 2026.
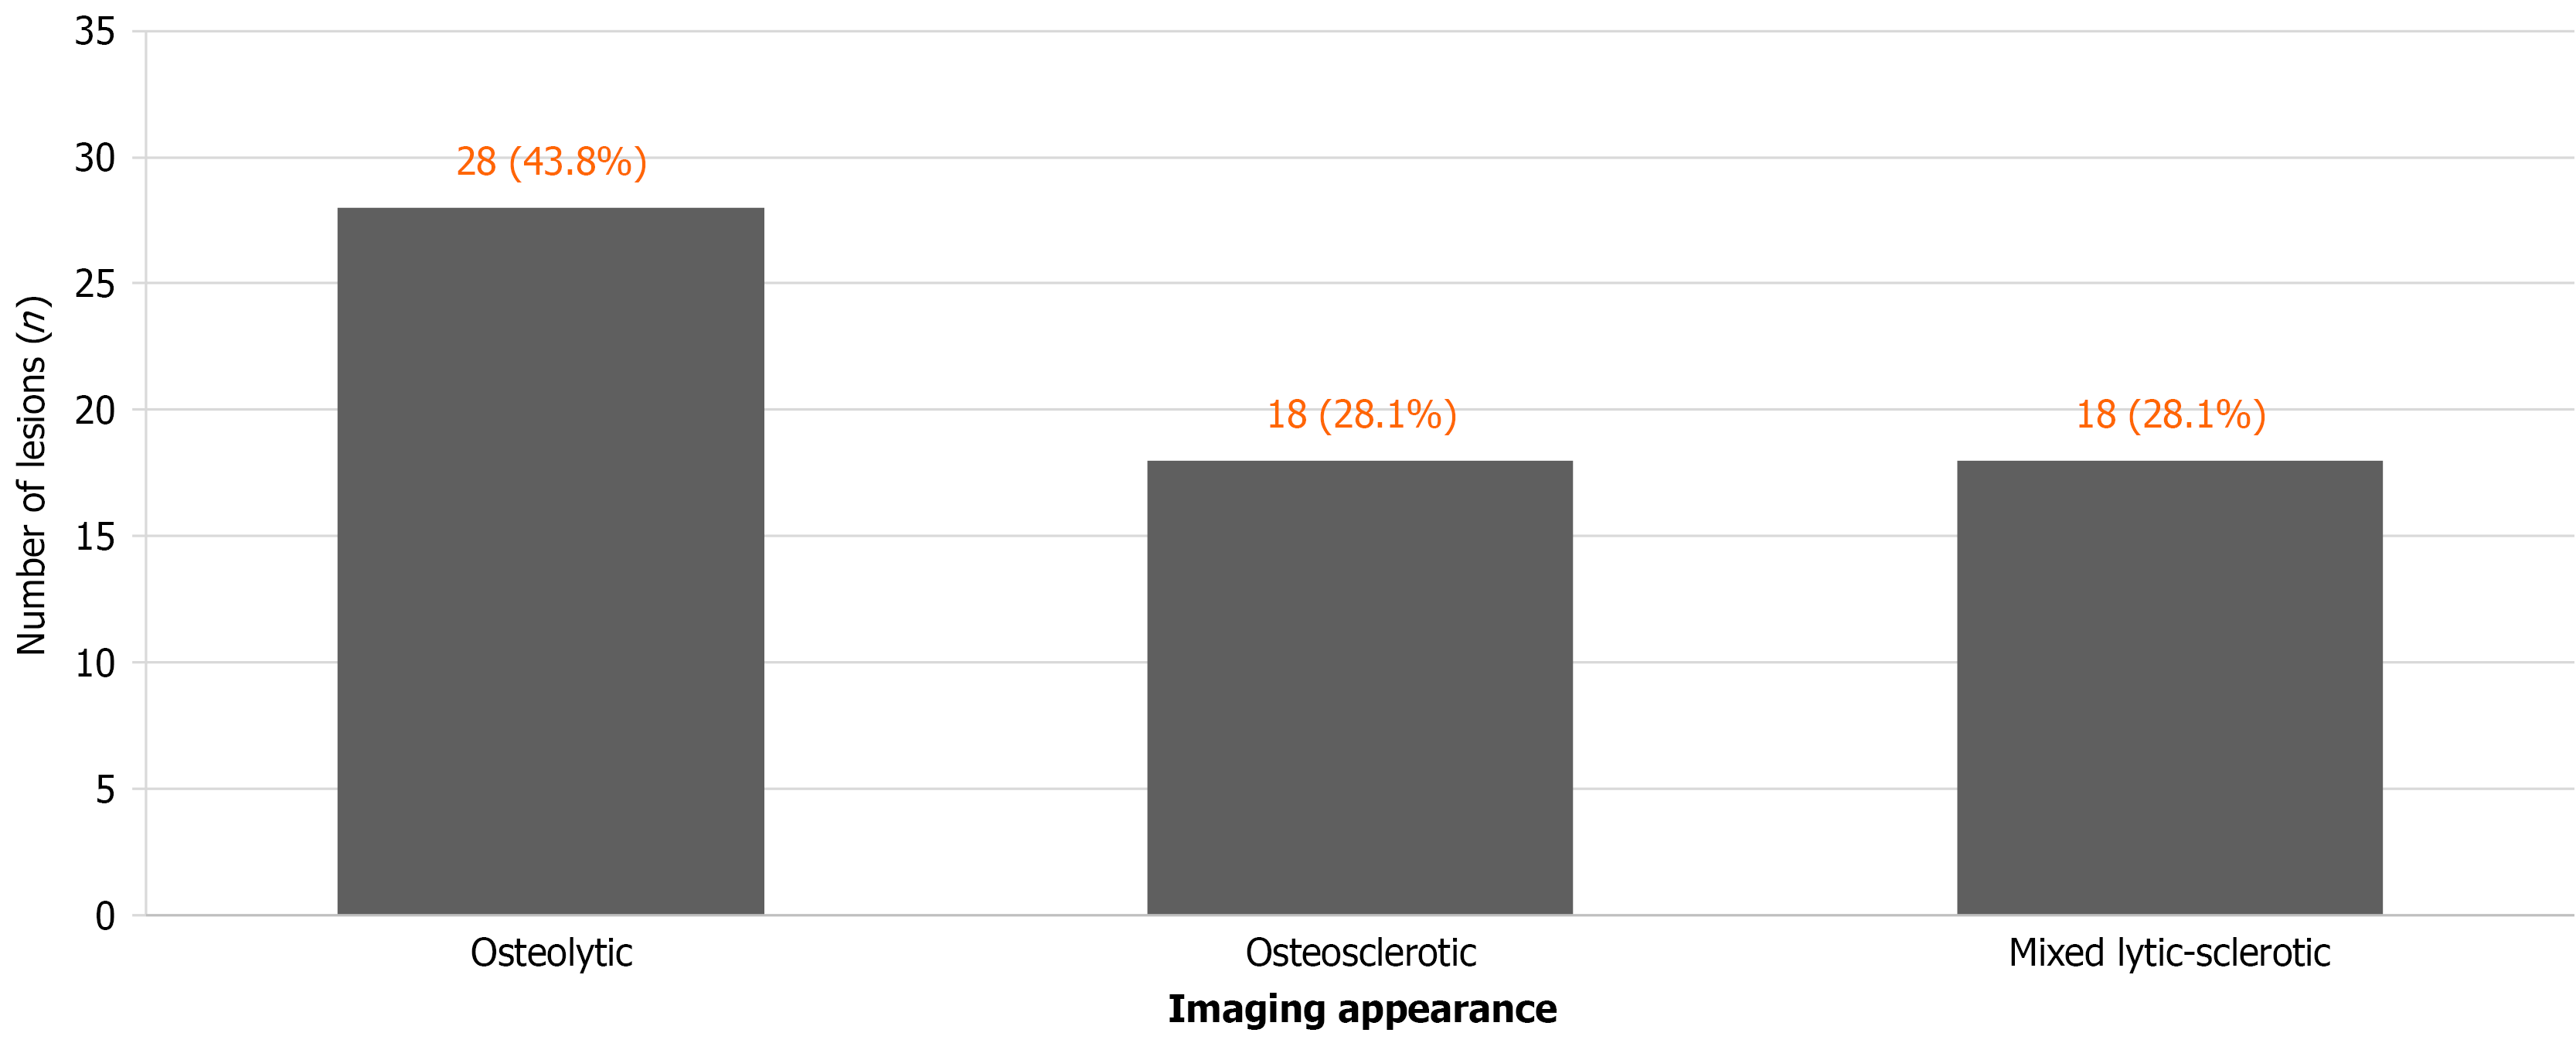
Figure 2 Imaging morphology of the 64 included biopsy procedures: Osteolytic, 28/64 (43.
8%); osteosclerotic, 18/64 (28.1%); mixed lytic-sclerotic, 18/64 (28.1%). Percentages use all 64 procedures as the denominator.
- Citation: Stuparu Adam AM, Osama A, Stere A, Cochior D, Pogărăşteanu ME, Moldovan CA, Tudorache IS, Adam R, Moldovan AD. Diagnostic performance of computed tomography-guided percutaneous bone biopsy in musculoskeletal oncology: A single-center cohort study. World J Radiol 2026; 18(10): 125901
- URL: https://www.wjgnet.com/1949-8470/full/v18/i10/125901.htm
- DOI: https://dx.doi.org/10.4329/wjr.125901