Copyright
©The Author(s) 2025.
World J Radiol. Aug 28, 2025; 17(8): 109373
Published online Aug 28, 2025. doi: 10.4329/wjr.v17.i8.109373
Published online Aug 28, 2025. doi: 10.4329/wjr.v17.i8.109373
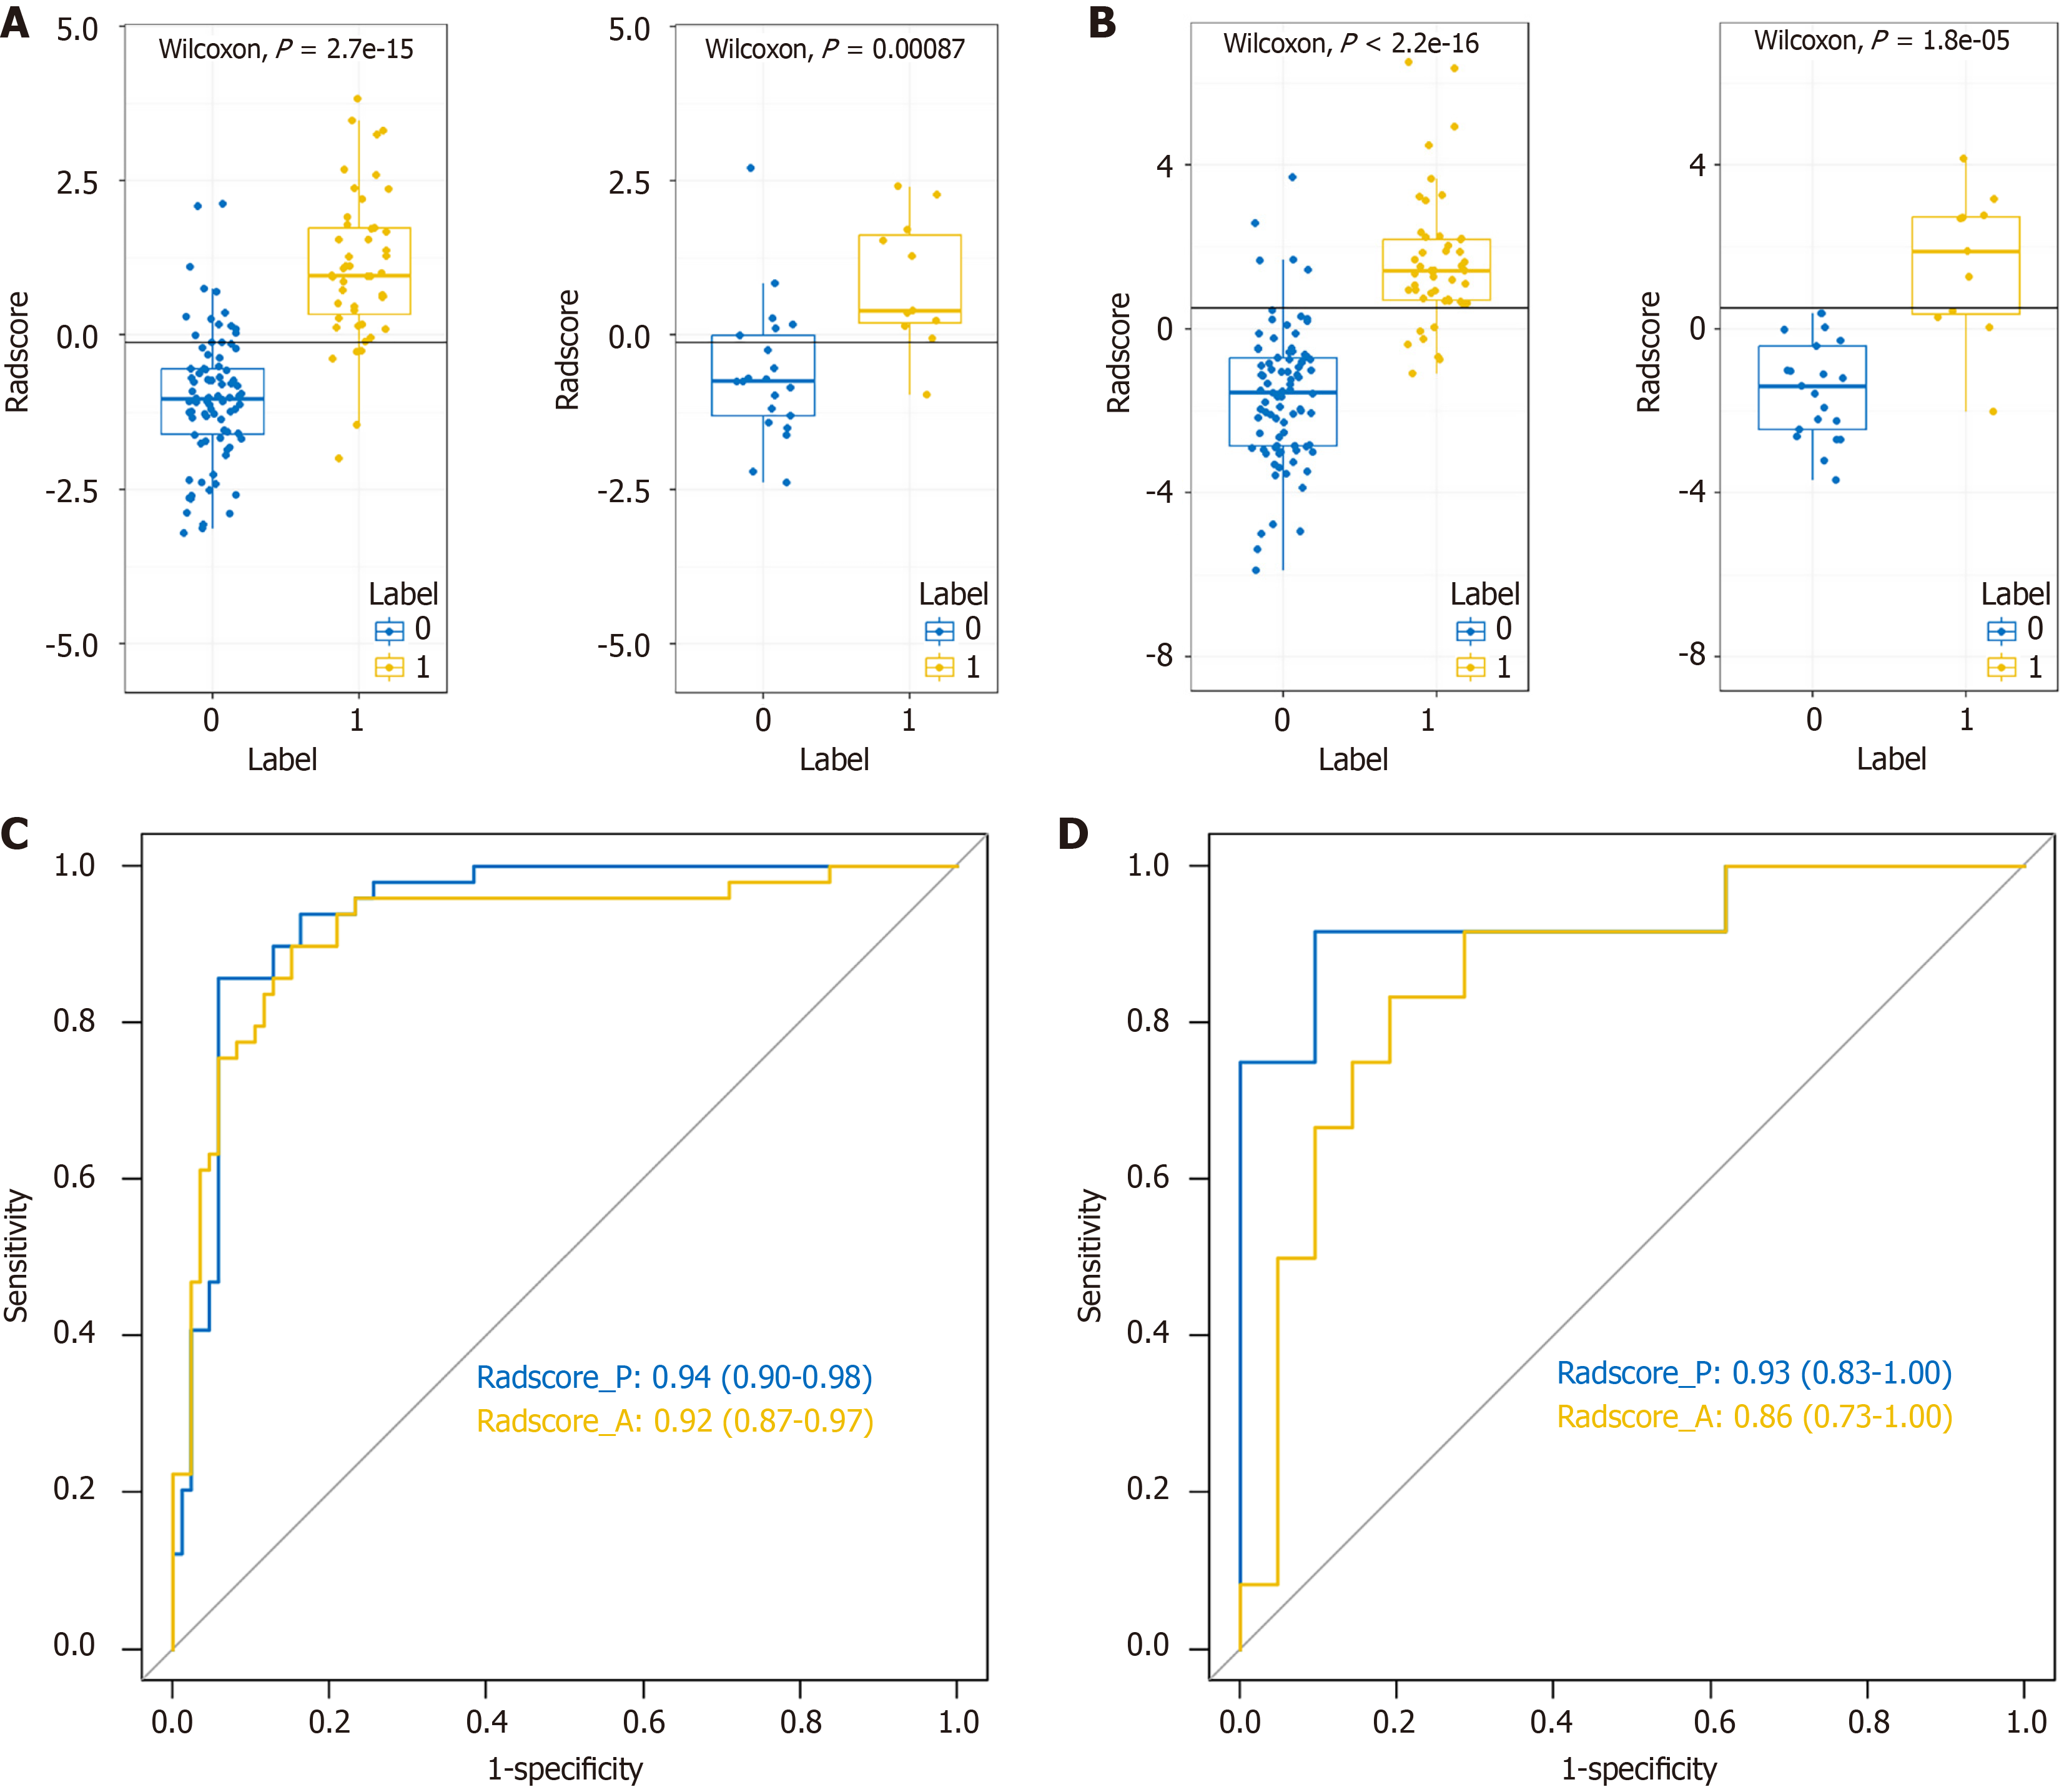
Figure 3 Diagnostic performance of the Radscore model.
A and B: Distribution of Radscore values for predicting LNM in the training (A) and test (B) cohorts. Blue dots represent patients without LNM, and yellow dots represent those with LNM; C and D: Receiver operating characteristic curves of the Radscore model for the training (C) and test (D) cohorts. Radscore_A refers to the model derived from arterial phase computed tomography images, while Radscore_P refers to the model derived from portal venous phase images. The area under the curve was used to evaluate model performance.
- Citation: Ren S, Qin B, Daniels MJ, Zeng L, Tian Y, Wang ZQ. Developing and validating a computed tomography radiomics strategy to predict lymph node metastasis in pancreatic cancer. World J Radiol 2025; 17(8): 109373
- URL: https://www.wjgnet.com/1949-8470/full/v17/i8/109373.htm
- DOI: https://dx.doi.org/10.4329/wjr.v17.i8.109373


