Copyright
©The Author(s) 2025.
World J Radiol. Aug 28, 2025; 17(8): 109373
Published online Aug 28, 2025. doi: 10.4329/wjr.v17.i8.109373
Published online Aug 28, 2025. doi: 10.4329/wjr.v17.i8.109373
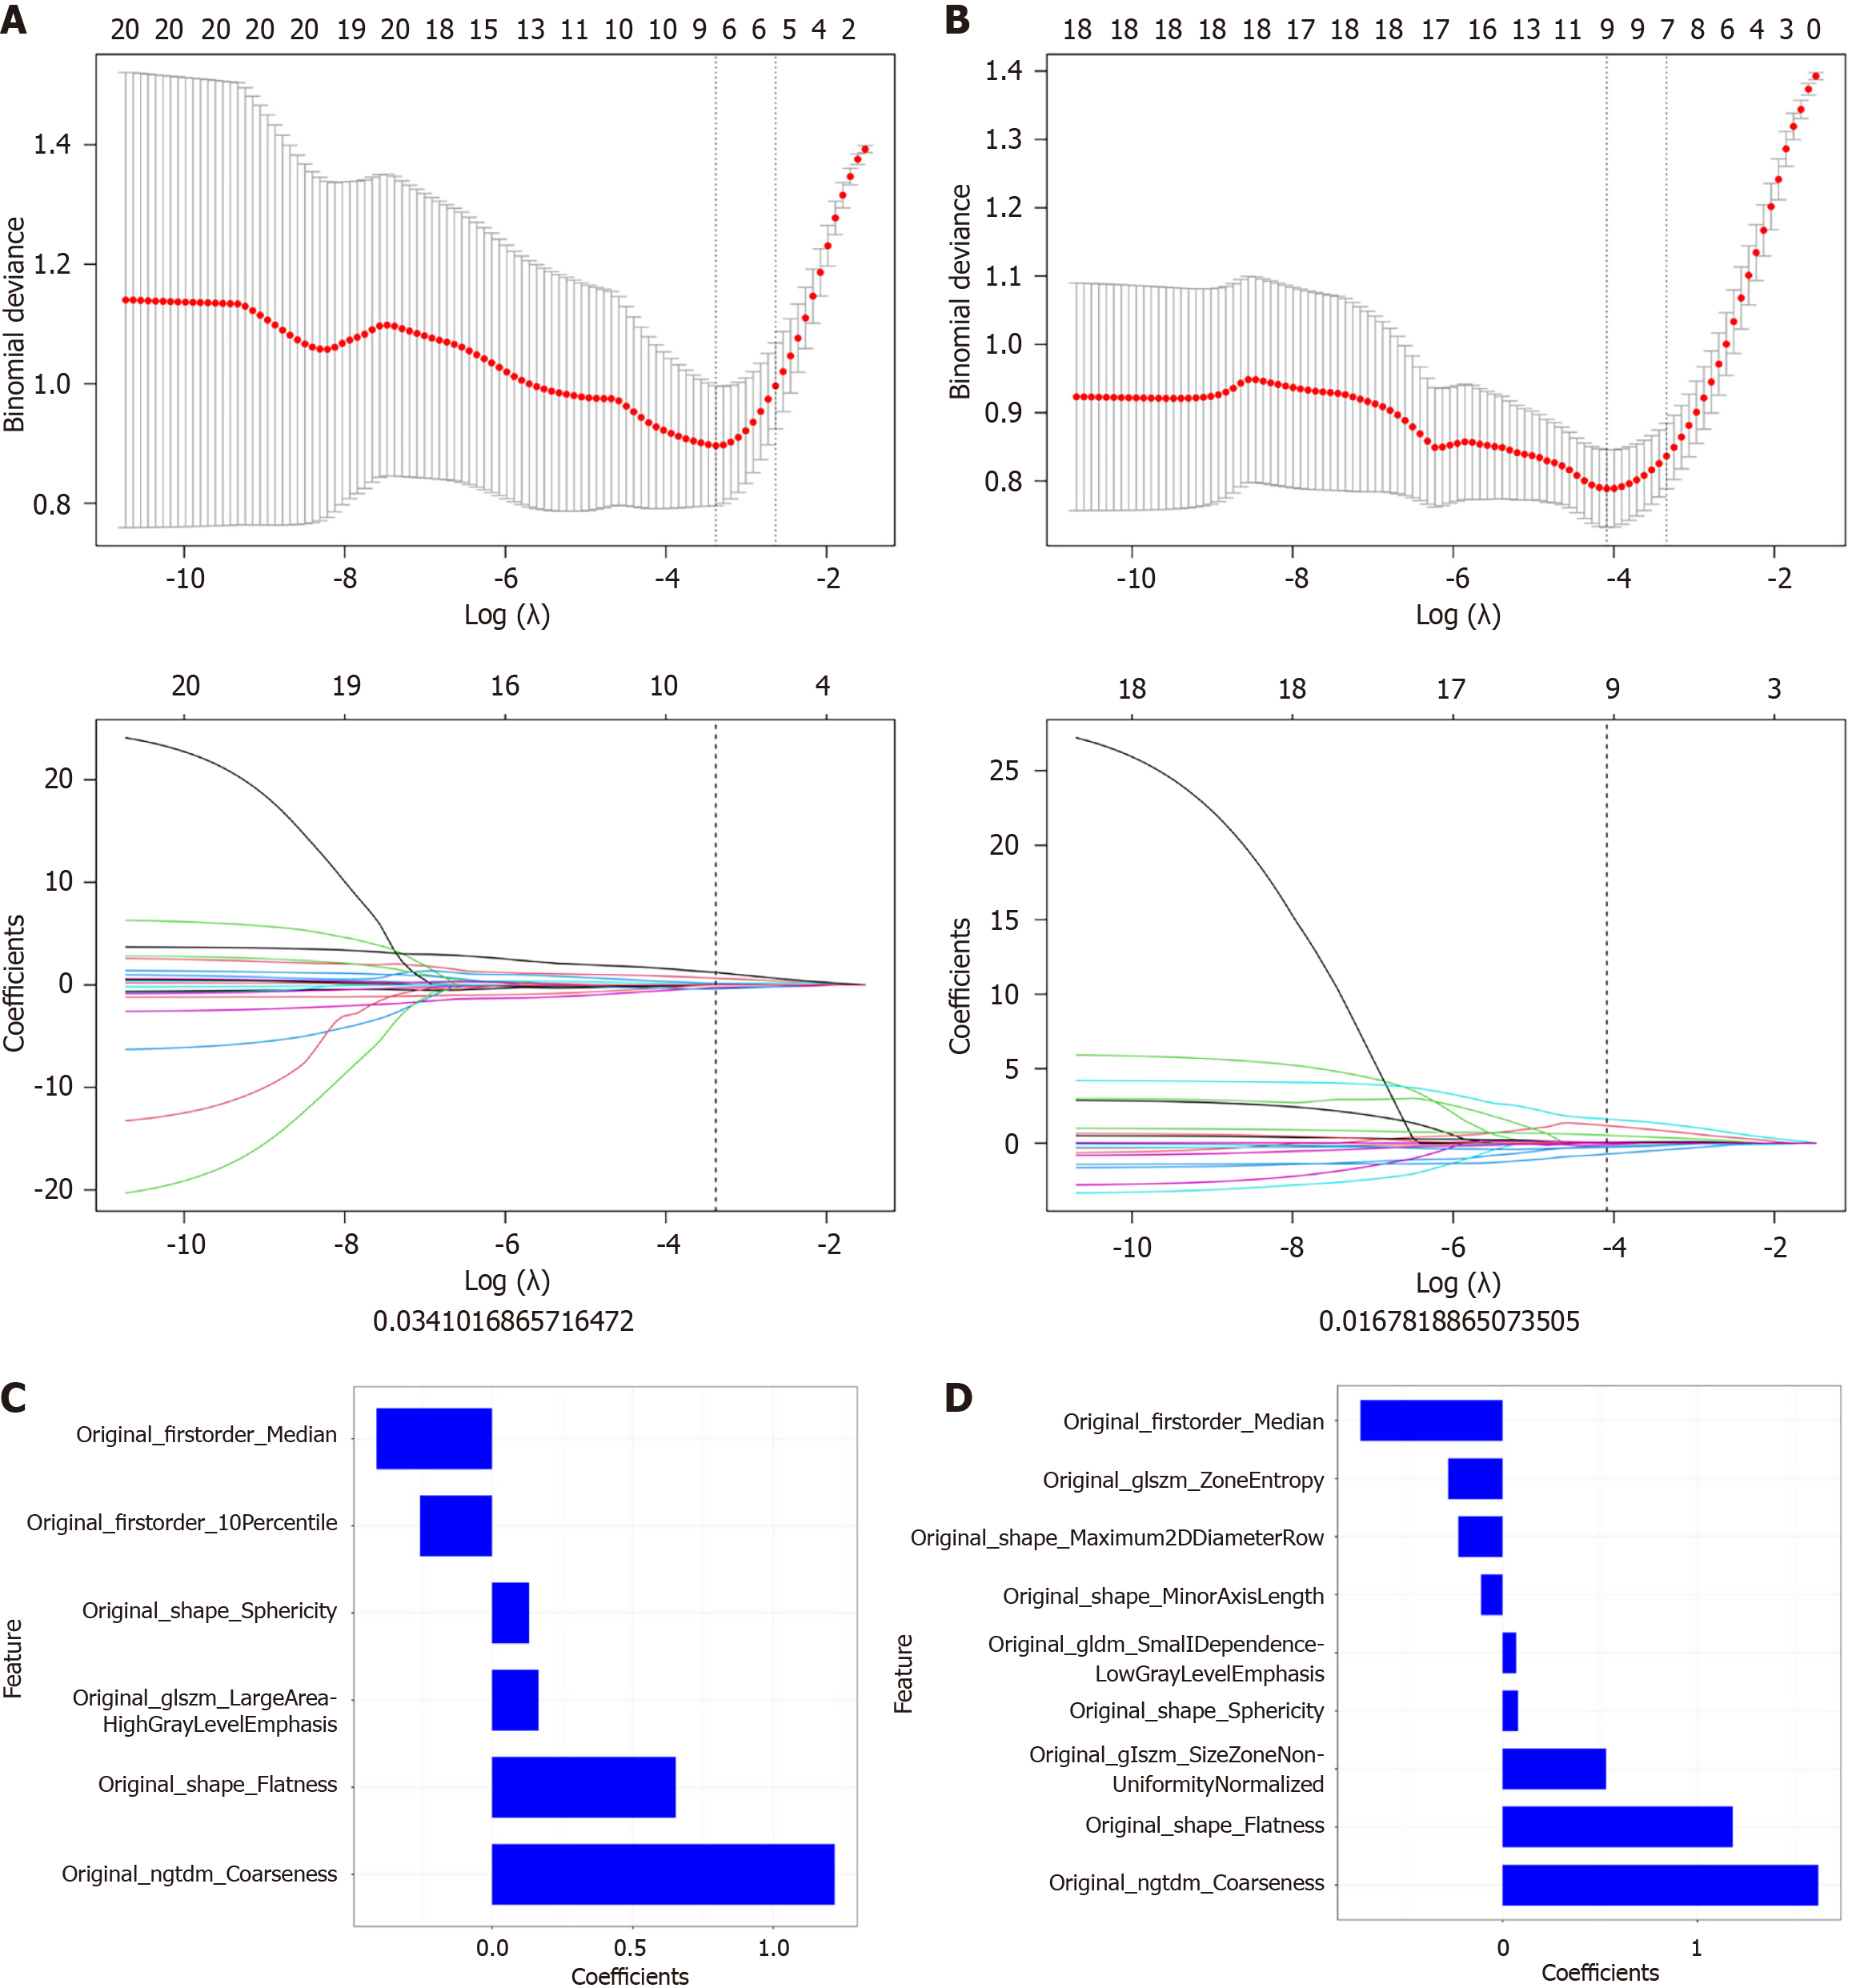
Figure 2 Radiomics feature selection and coefficient visualization using LASSO regression.
A and B: The optimal regularization parameter (λ) for the LASSO regression model was selected via 10-fold cross-validation in the training (A) and test (B) cohorts. The plots display binomial deviance against log(λ), with the vertical dashed line indicating the optimal log(λ) of -4. This resulted in 6 non-zero features for the training cohort and 9 for the test cohort; C and D: The cor
- Citation: Ren S, Qin B, Daniels MJ, Zeng L, Tian Y, Wang ZQ. Developing and validating a computed tomography radiomics strategy to predict lymph node metastasis in pancreatic cancer. World J Radiol 2025; 17(8): 109373
- URL: https://www.wjgnet.com/1949-8470/full/v17/i8/109373.htm
- DOI: https://dx.doi.org/10.4329/wjr.v17.i8.109373


