Copyright
©The Author(s) 2025.
World J Radiol. Jun 28, 2025; 17(6): 106682
Published online Jun 28, 2025. doi: 10.4329/wjr.v17.i6.106682
Published online Jun 28, 2025. doi: 10.4329/wjr.v17.i6.106682
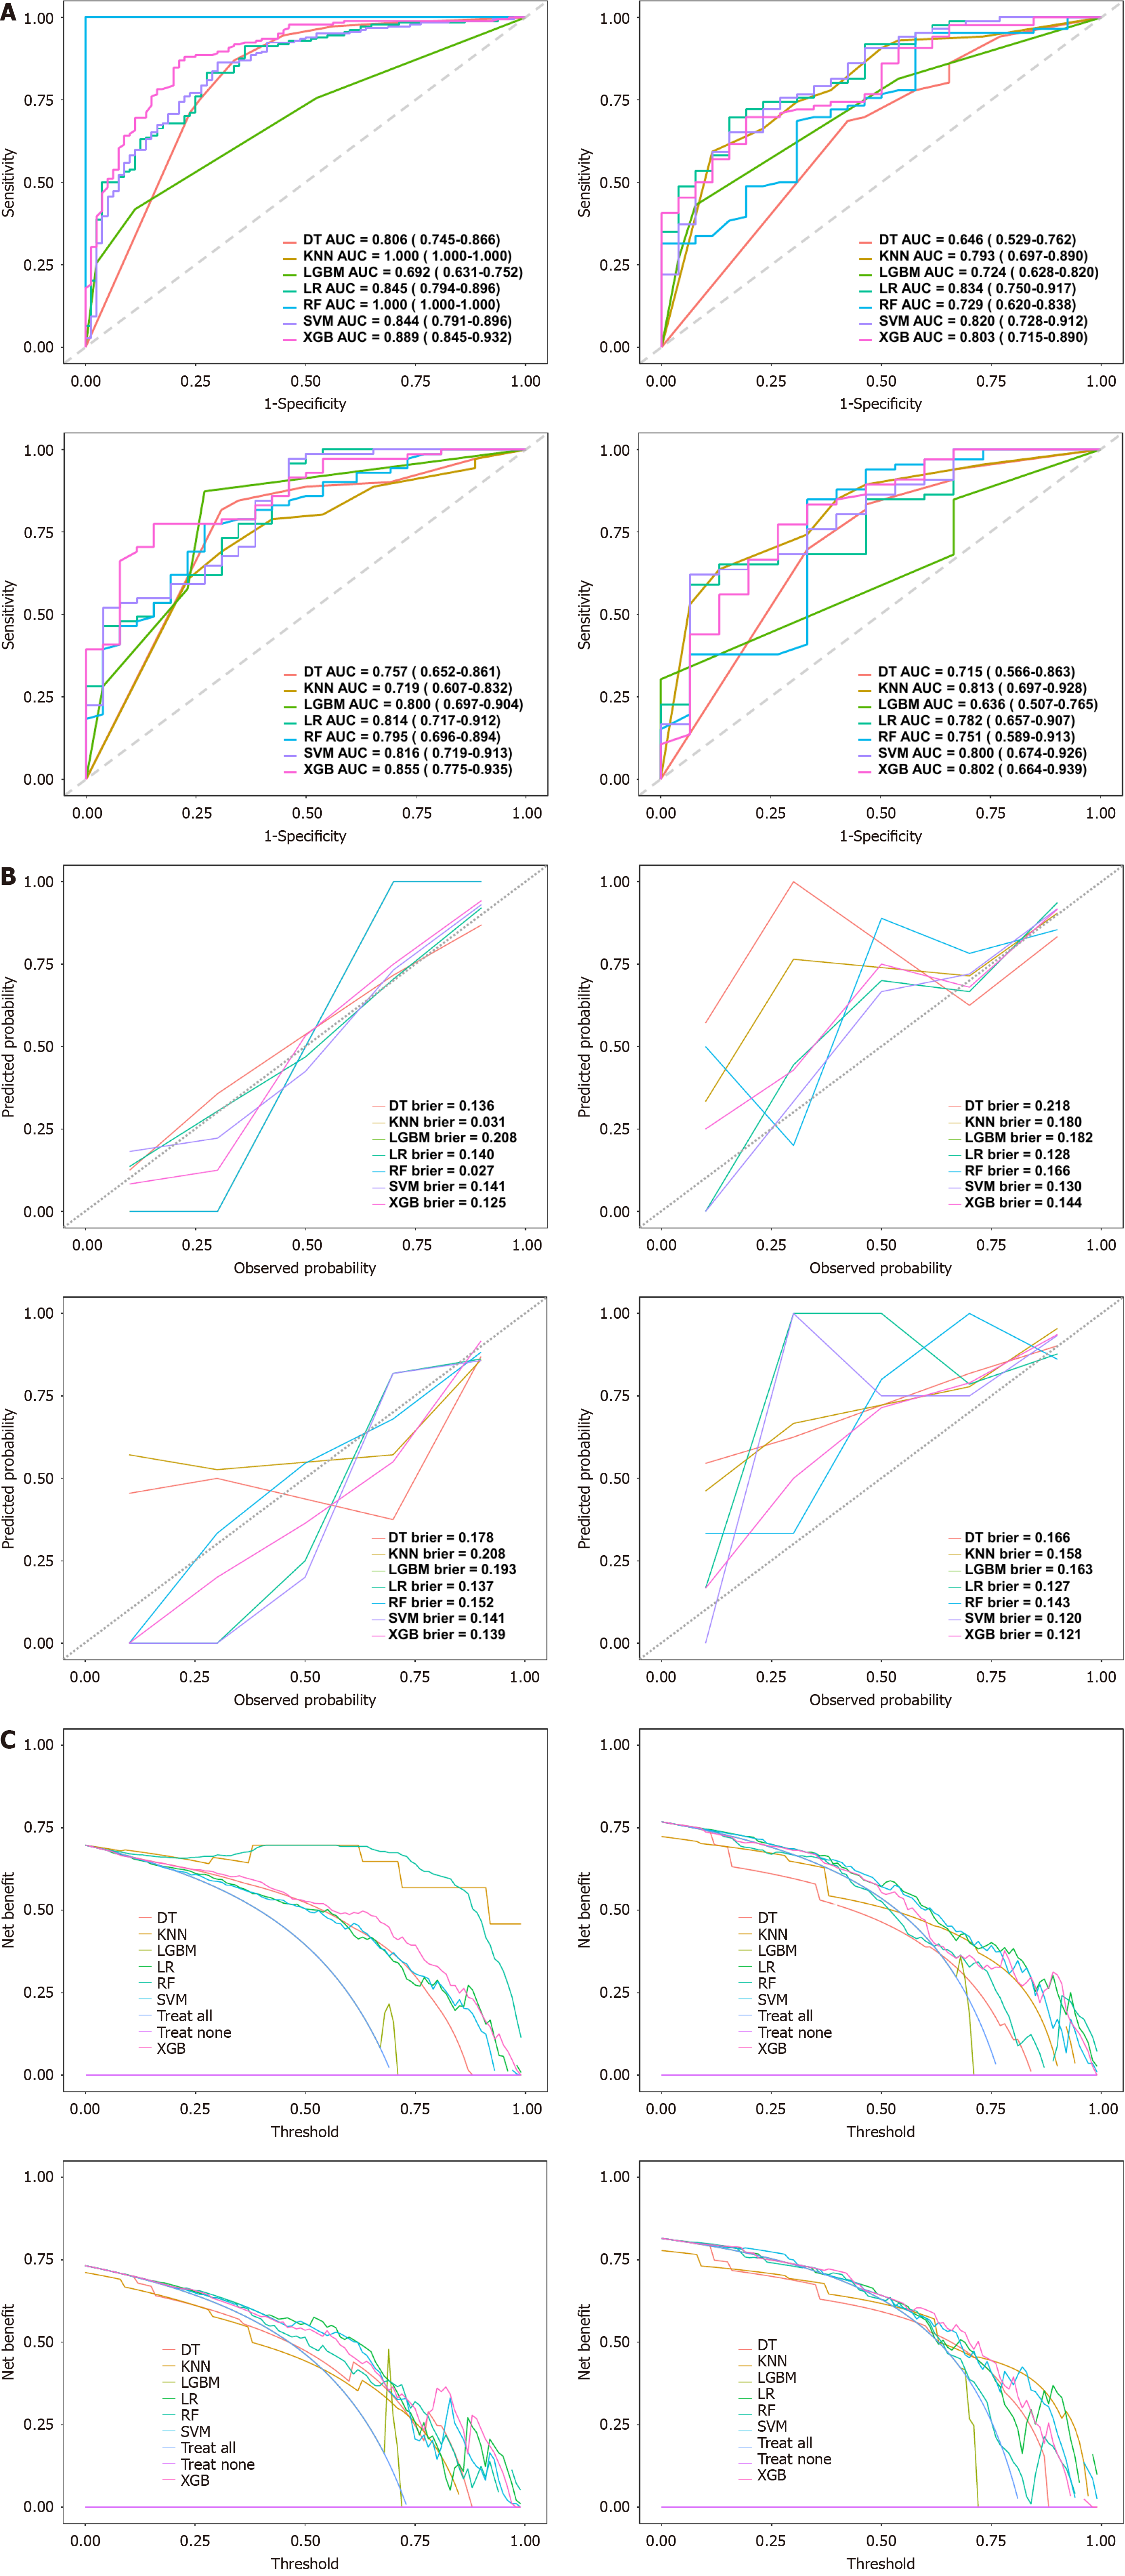
Figure 5 Performance evaluation of seven machine learning models.
A: Receiver operating characteristic curves of different models across the training, validation, temporal test, and external test cohorts (from left to right). The area under the receiver operating characteristic curve quantifies classification performance, with higher area under the receiver operating characteristic curve values indicating superior discrimination; B: Calibration curves for different models in the training, validation, temporal test, and external test cohorts (from left to right). These curves assess the agreement between predicted probabilities and actual outcomes, with lower Brier scores indicating better calibration, as reflected by proximity to the 45° diagonal line; C: Decision curve analysis in the training, validation, temporal test, and external test cohorts (from left to right), evaluating the clinical net benefit of different models across probability thresholds. Overall, the extreme gradient boosting model exhibits consistent and superior performance across multiple cohorts. DT: Decision trees; KNM: K-nearest neighbors; LR: Logistic regression; RF: Random forests; LGBM: Light gradient boosting machines; SVM: Support vector machines; XGB: Extreme gradient boosting; AUC: Area under the receiver operating characteristic curve.
- Citation: Wang H, Wang X, Du YS, Wang Y, Bai ZJ, Wu D, Tang WL, Zeng HL, Tao J, He J. Non-contrast computed tomography radiomics model to predict benign and malignant thyroid nodules with lobe segmentation: A dual-center study. World J Radiol 2025; 17(6): 106682
- URL: https://www.wjgnet.com/1949-8470/full/v17/i6/106682.htm
- DOI: https://dx.doi.org/10.4329/wjr.v17.i6.106682


