Copyright
©The Author(s) 2025.
World J Radiol. Jun 28, 2025; 17(6): 106682
Published online Jun 28, 2025. doi: 10.4329/wjr.v17.i6.106682
Published online Jun 28, 2025. doi: 10.4329/wjr.v17.i6.106682
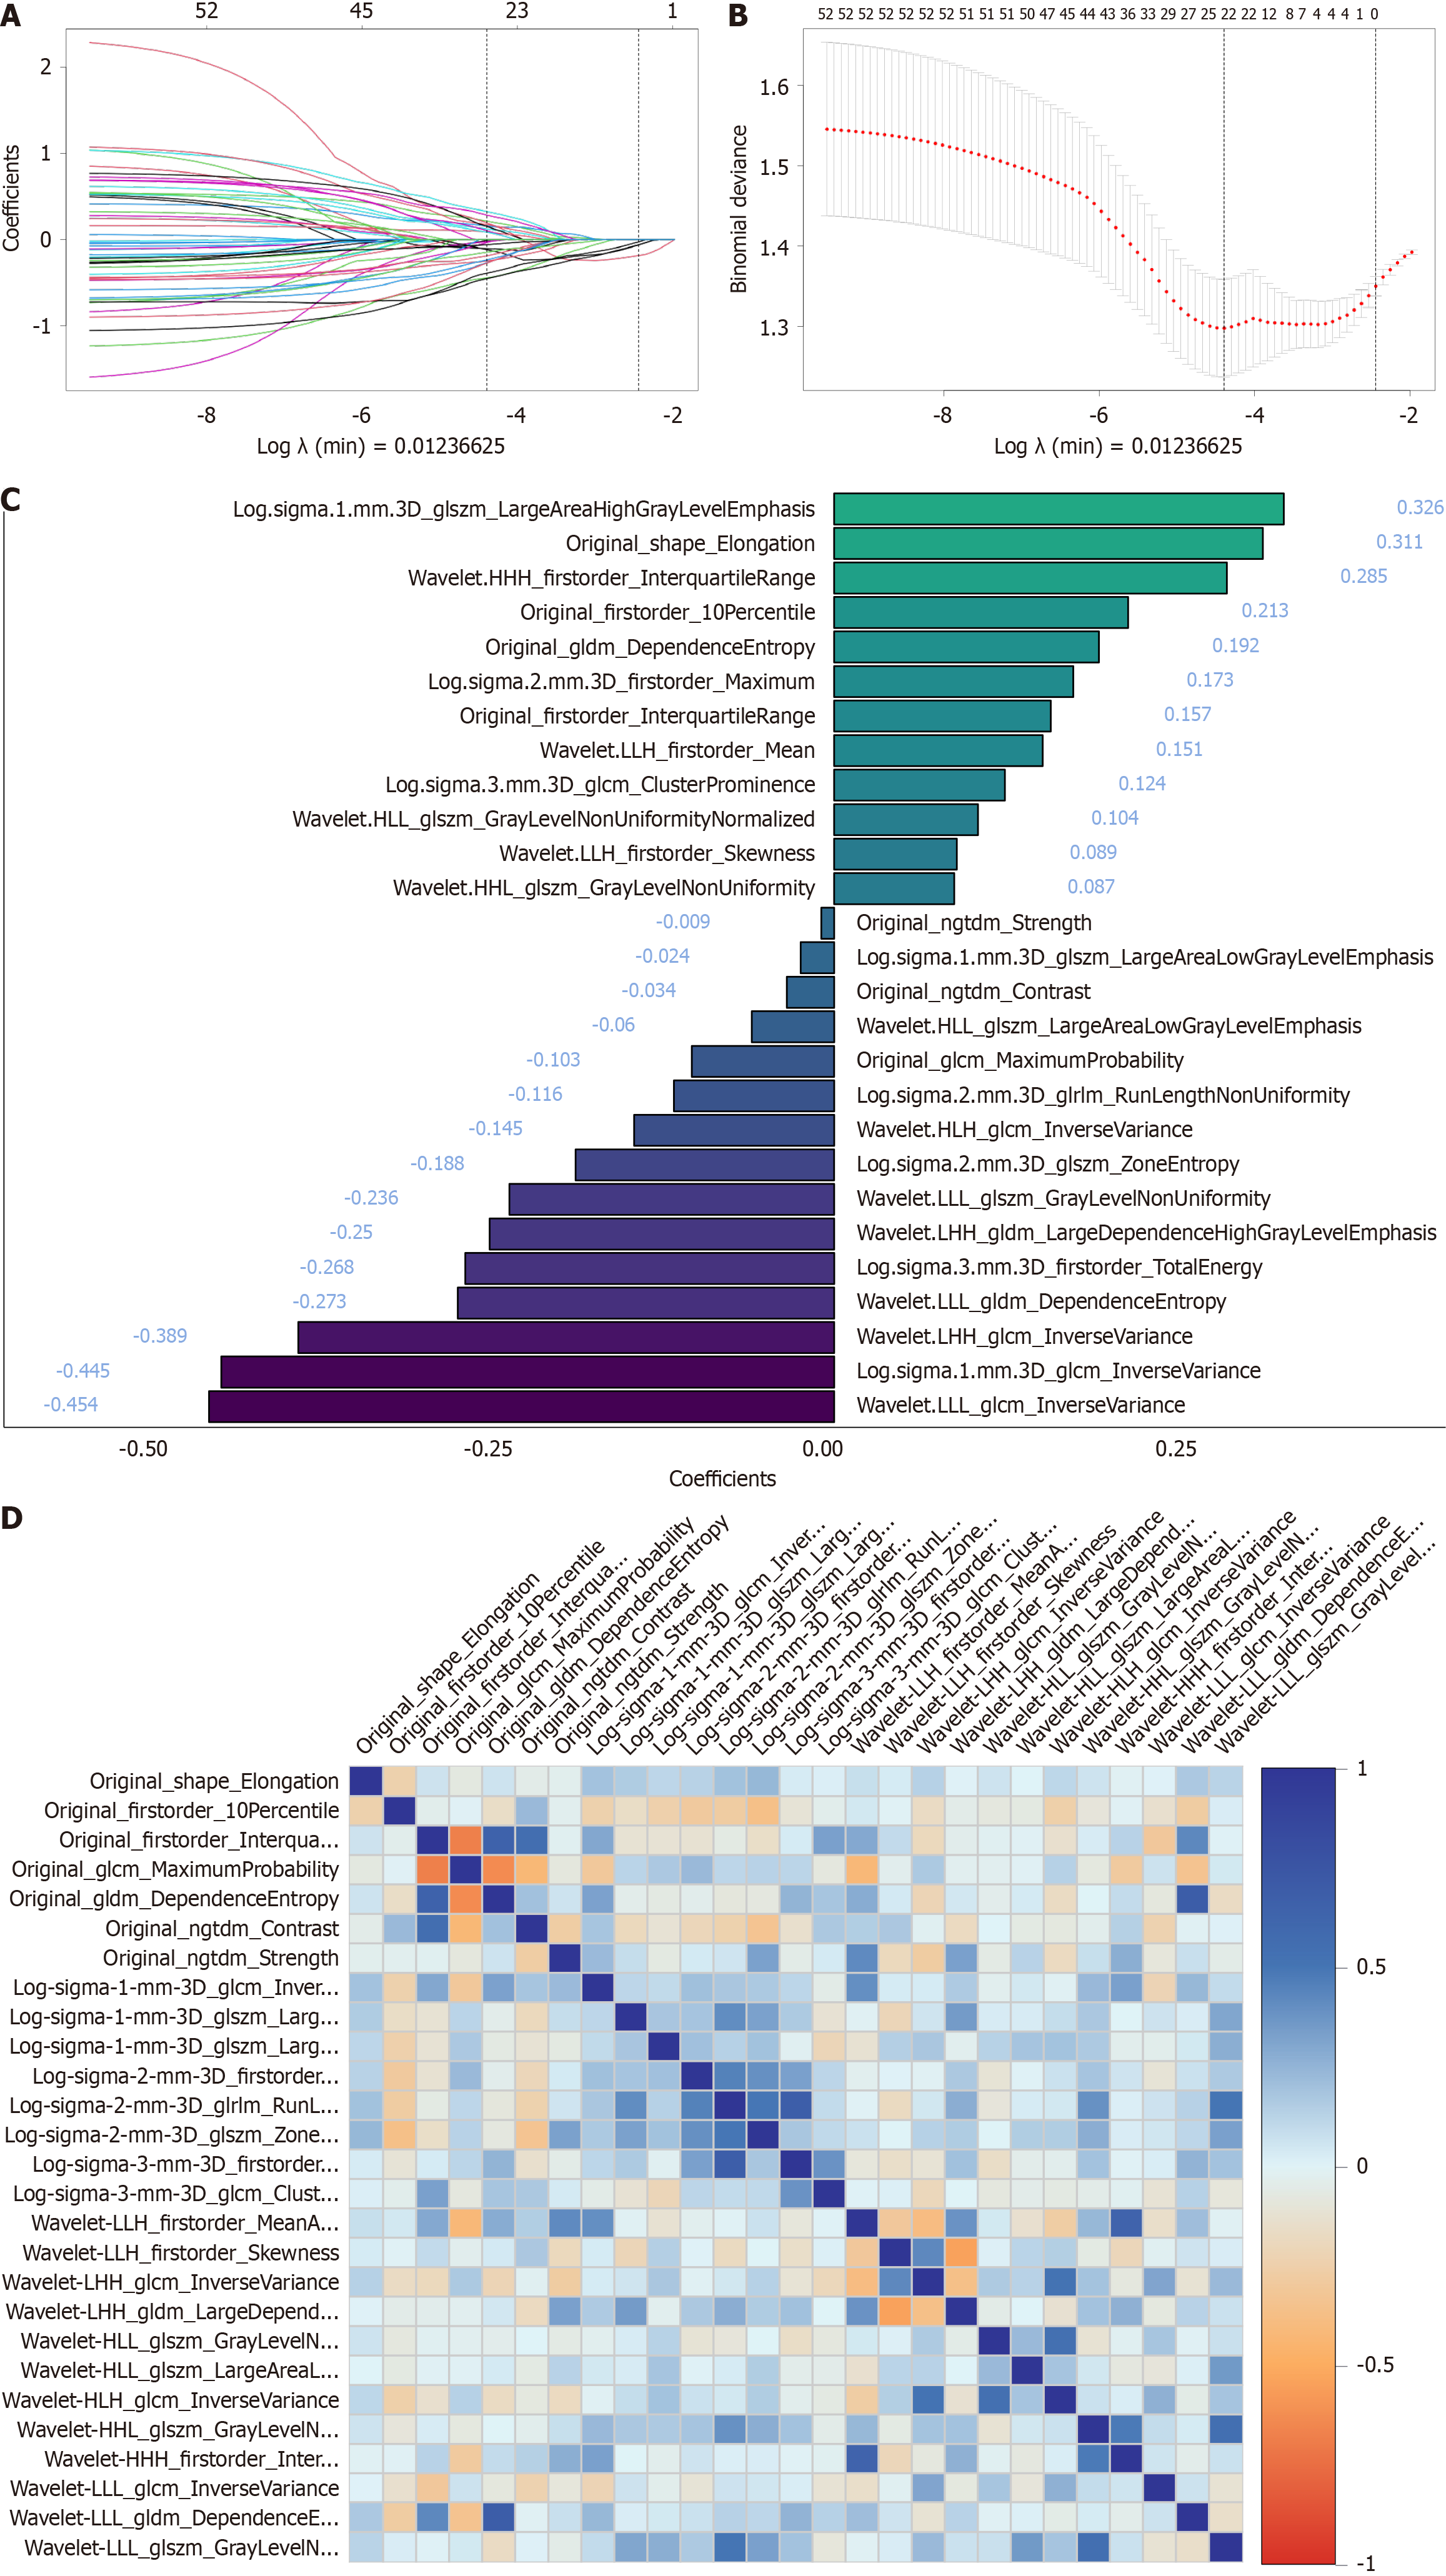
Figure 3 Least absolute shrinkage and selection operator feature selection and comparison.
A: Least absolute shrinkage and selection operator feature selection plot, where the horizontal axis represents the logarithm of the regularization parameter (λ), and the vertical axis denotes the corresponding feature weights. As λ increases, feature weights progressively decrease until exclusion at zero; B: 10-fold cross-validation curve, where the vertical axis represents the cross-validated mean squared error. The λ-value at the lowest point (λ min) is identified as the optimal regularization parameter, balancing model complexity and prediction error; C: 27 radiomic features and their corresponding weight coefficients retained after least absolute shrinkage and selection operator regression; D: Correlation heatmap of the 27 selected radiomic features, with darker colors indicating stronger correlations.
- Citation: Wang H, Wang X, Du YS, Wang Y, Bai ZJ, Wu D, Tang WL, Zeng HL, Tao J, He J. Non-contrast computed tomography radiomics model to predict benign and malignant thyroid nodules with lobe segmentation: A dual-center study. World J Radiol 2025; 17(6): 106682
- URL: https://www.wjgnet.com/1949-8470/full/v17/i6/106682.htm
- DOI: https://dx.doi.org/10.4329/wjr.v17.i6.106682


