Copyright
©The Author(s) 2025.
World J Radiol. May 28, 2025; 17(5): 106084
Published online May 28, 2025. doi: 10.4329/wjr.v17.i5.106084
Published online May 28, 2025. doi: 10.4329/wjr.v17.i5.106084
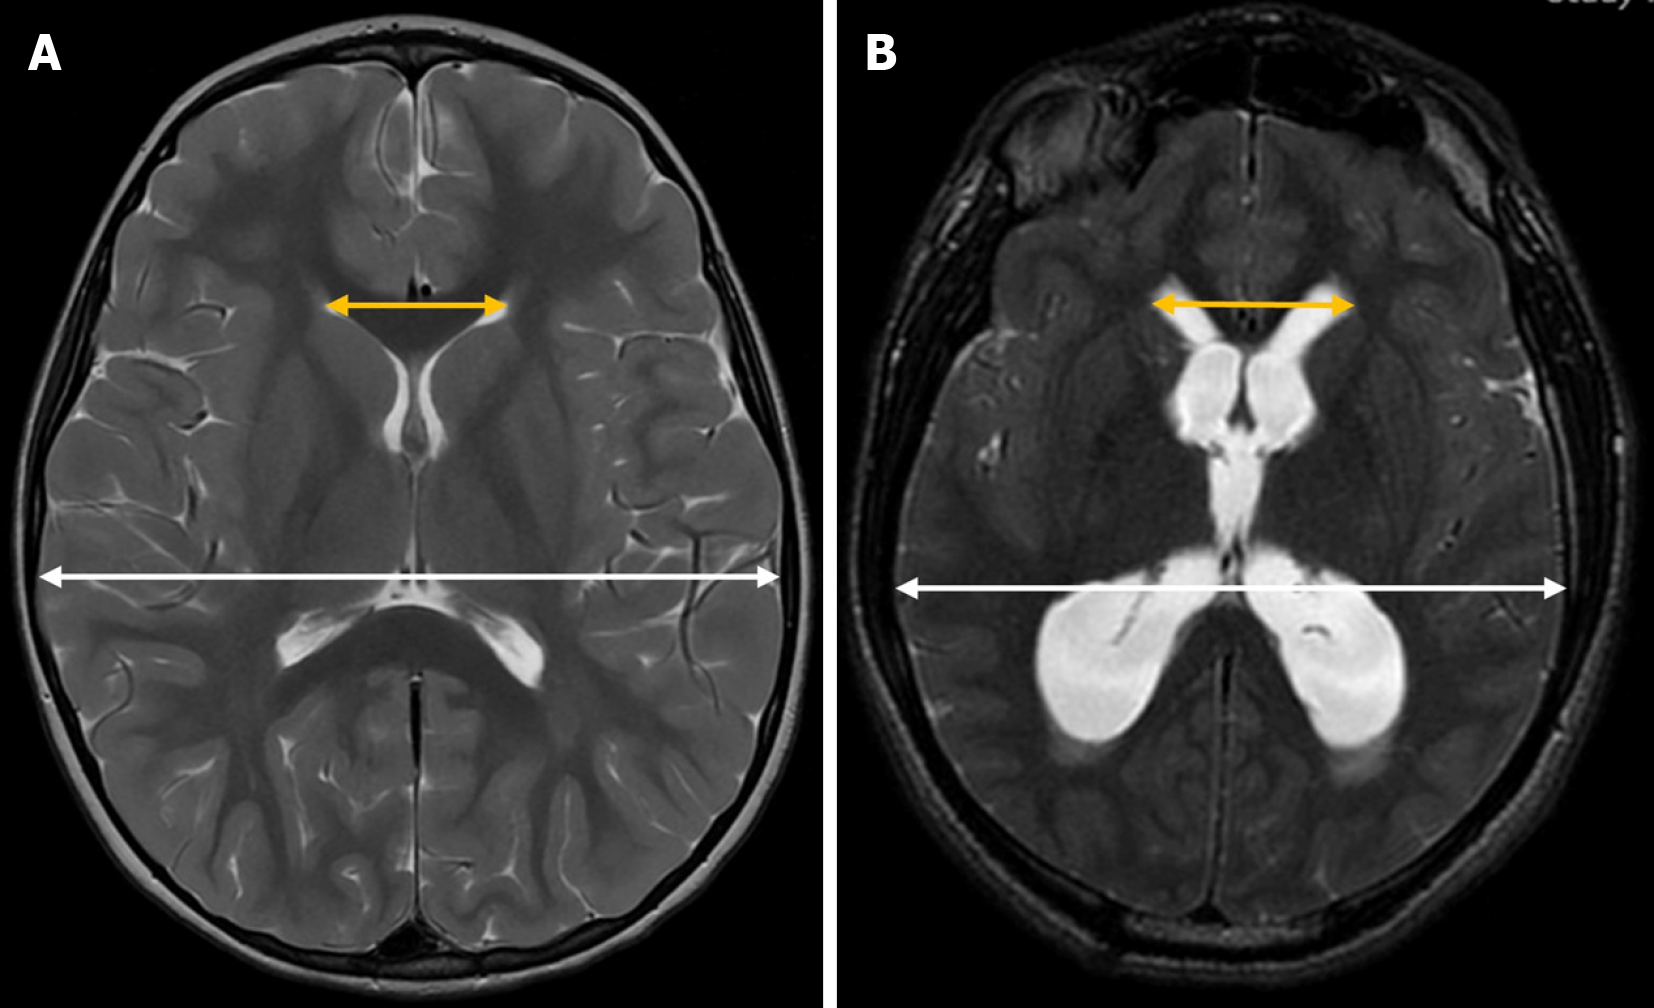
Figure 3 Evans’ index.
Axial T2-weighted magnetic resonance imaging illustrating Evans’ index. It is calculated by dividing the maximum width of the frontal horns of the lateral ventricles (yellow arrow) by the maximum cranial width (white arrow) in the same axial plane. A: Normal Evans’ index in a 4-year-old girl with a 4-week history of headache; B: Increased Evans’ index in a 15-year-old boy with supratentorial hydrocephalus due to an epidermoid cyst in the pineal gland.
- Citation: Navarro-Ballester A, Álvaro-Ballester R, Lara-Martínez MÁ. Imaging biomarkers for detection and longitudinal monitoring of ventricular abnormalities from birth to childhood. World J Radiol 2025; 17(5): 106084
- URL: https://www.wjgnet.com/1949-8470/full/v17/i5/106084.htm
- DOI: https://dx.doi.org/10.4329/wjr.v17.i5.106084


