Copyright
©The Author(s) 2025.
World J Radiol. May 28, 2025; 17(5): 104808
Published online May 28, 2025. doi: 10.4329/wjr.v17.i5.104808
Published online May 28, 2025. doi: 10.4329/wjr.v17.i5.104808
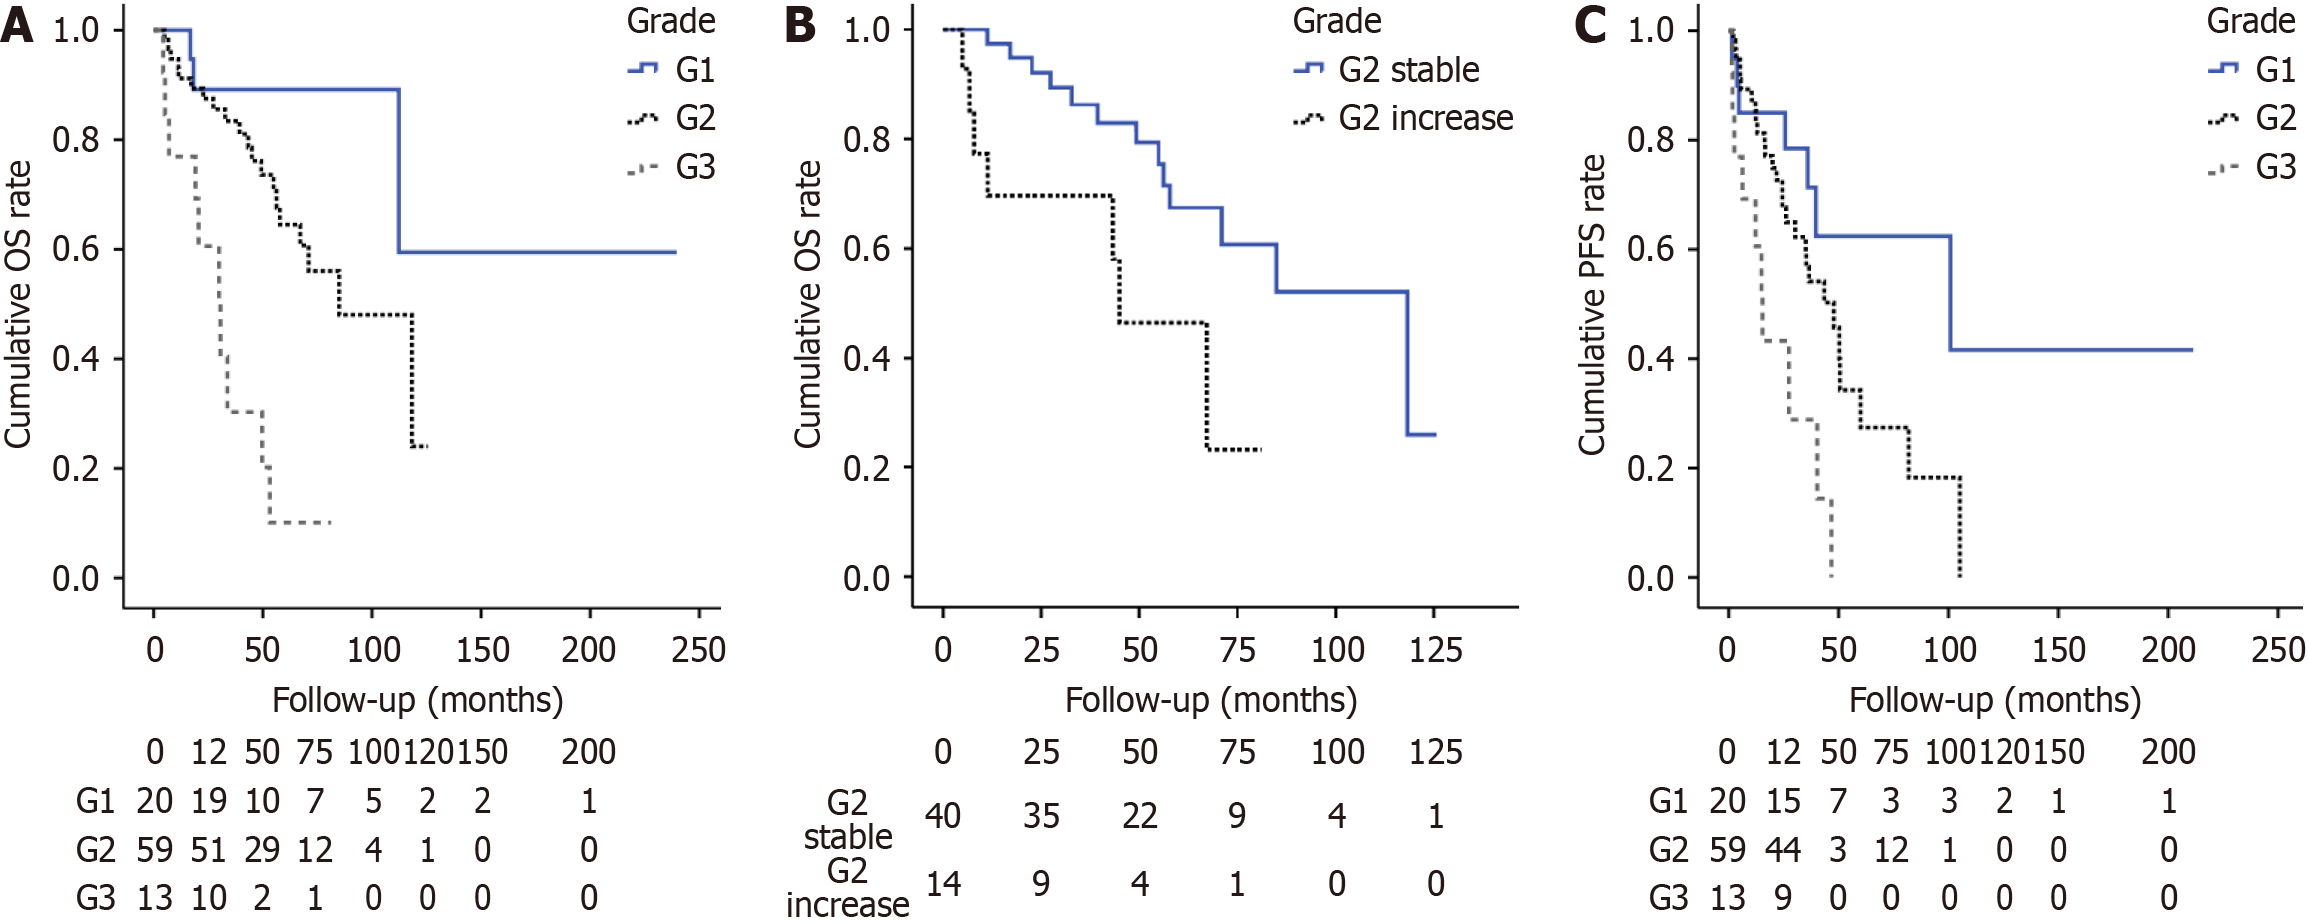
Figure 2 Survival outcomes of gastroenteropancreatic neuroendocrine tumors: analysis of overall survival and progression-free survival based on initial grades and G2 group variations.
Numbers at risk indicate patients remaining in follow-up at each time point, calculated via reverse Kaplan-Meier method (G1: Ki-67 ≤ 2%; G2: 3%-20%; G3: > 20%). A: The overall survival (OS) of patients with gastroenteropancreatic neuroendocrine tumors (GEP-NETs) with different grades at initial diagnosis. Patients with G1 or G2 had better overall survival rates when compared with patients with G3 (P < 0.001); B: The OS of patients with GEP-NETs in stable G2 and increased G2 groups. “Stable G2” (n = 32): Liver metastases retained G2 classification. “Increased G2” (n = 14): Liver metastases upgraded from G2 (primary) to G3. The OS of stable G2 patients was longer than for increased G2 patients (P = 0.016); C: Progression-free survival in patients with GEP-NETs with different grades at initial diagnosis. Patients with G1 or G2 had a better progression-free survival when compared with patients with G3 grades (P = 0.001).
- Citation: Ying LL, Li KN, Li WT, He XH, Chen C. Computed tomography-guided percutaneous biopsy for assessing tumor heterogeneity in neuroendocrine tumor metastases to the liver. World J Radiol 2025; 17(5): 104808
- URL: https://www.wjgnet.com/1949-8470/full/v17/i5/104808.htm
- DOI: https://dx.doi.org/10.4329/wjr.v17.i5.104808


