Copyright
©The Author(s) 2025.
World J Radiol. May 28, 2025; 17(5): 104272
Published online May 28, 2025. doi: 10.4329/wjr.v17.i5.104272
Published online May 28, 2025. doi: 10.4329/wjr.v17.i5.104272
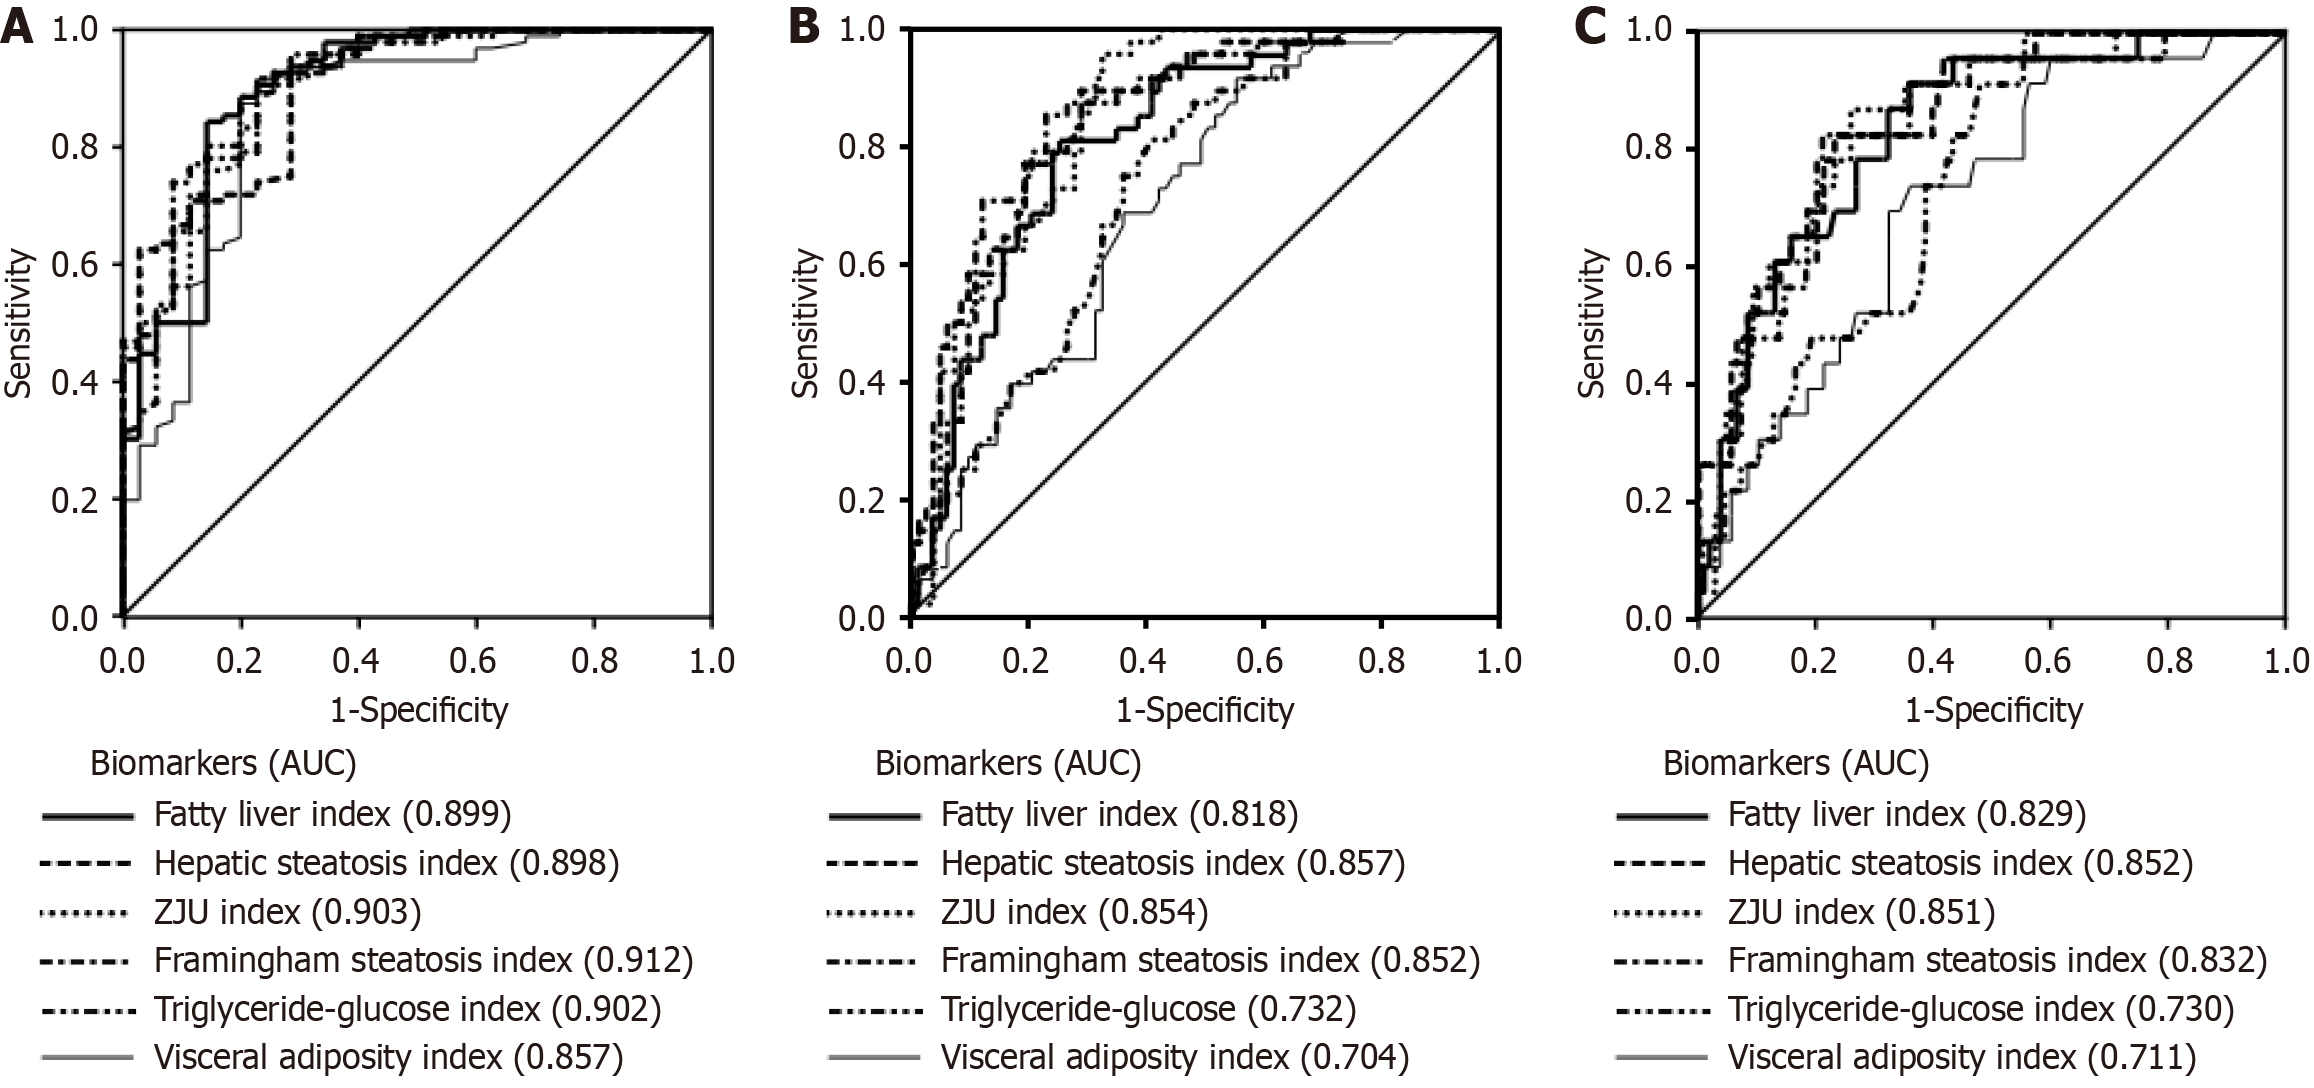
Figure 4 Area under the receiver operating characteristic curves.
A: The steatosis biomarkers for detecting nonalcoholic fatty liver disease [magnetic resonance imaging proton density fat fraction (MRI-PDFF) ≥ 5%]; B: The steatosis biomarkers for detecting moderate-to-severe steatosis (MRI-PDFF ≥ 11%); C: The steatosis biomarkers for detecting severe steatosis (MRI-PDFF ≥ 17%). AUC: Area under the receiver operating characteristic curve.
- Citation: Chen JL, Duan SJ, Xie S, Yao SK. Diagnostic accuracy of noninvasive steatosis biomarkers with magnetic resonance imaging proton density fat fraction as gold standard. World J Radiol 2025; 17(5): 104272
- URL: https://www.wjgnet.com/1949-8470/full/v17/i5/104272.htm
- DOI: https://dx.doi.org/10.4329/wjr.v17.i5.104272


