Copyright
©The Author(s) 2025.
World J Radiol. May 28, 2025; 17(5): 104272
Published online May 28, 2025. doi: 10.4329/wjr.v17.i5.104272
Published online May 28, 2025. doi: 10.4329/wjr.v17.i5.104272
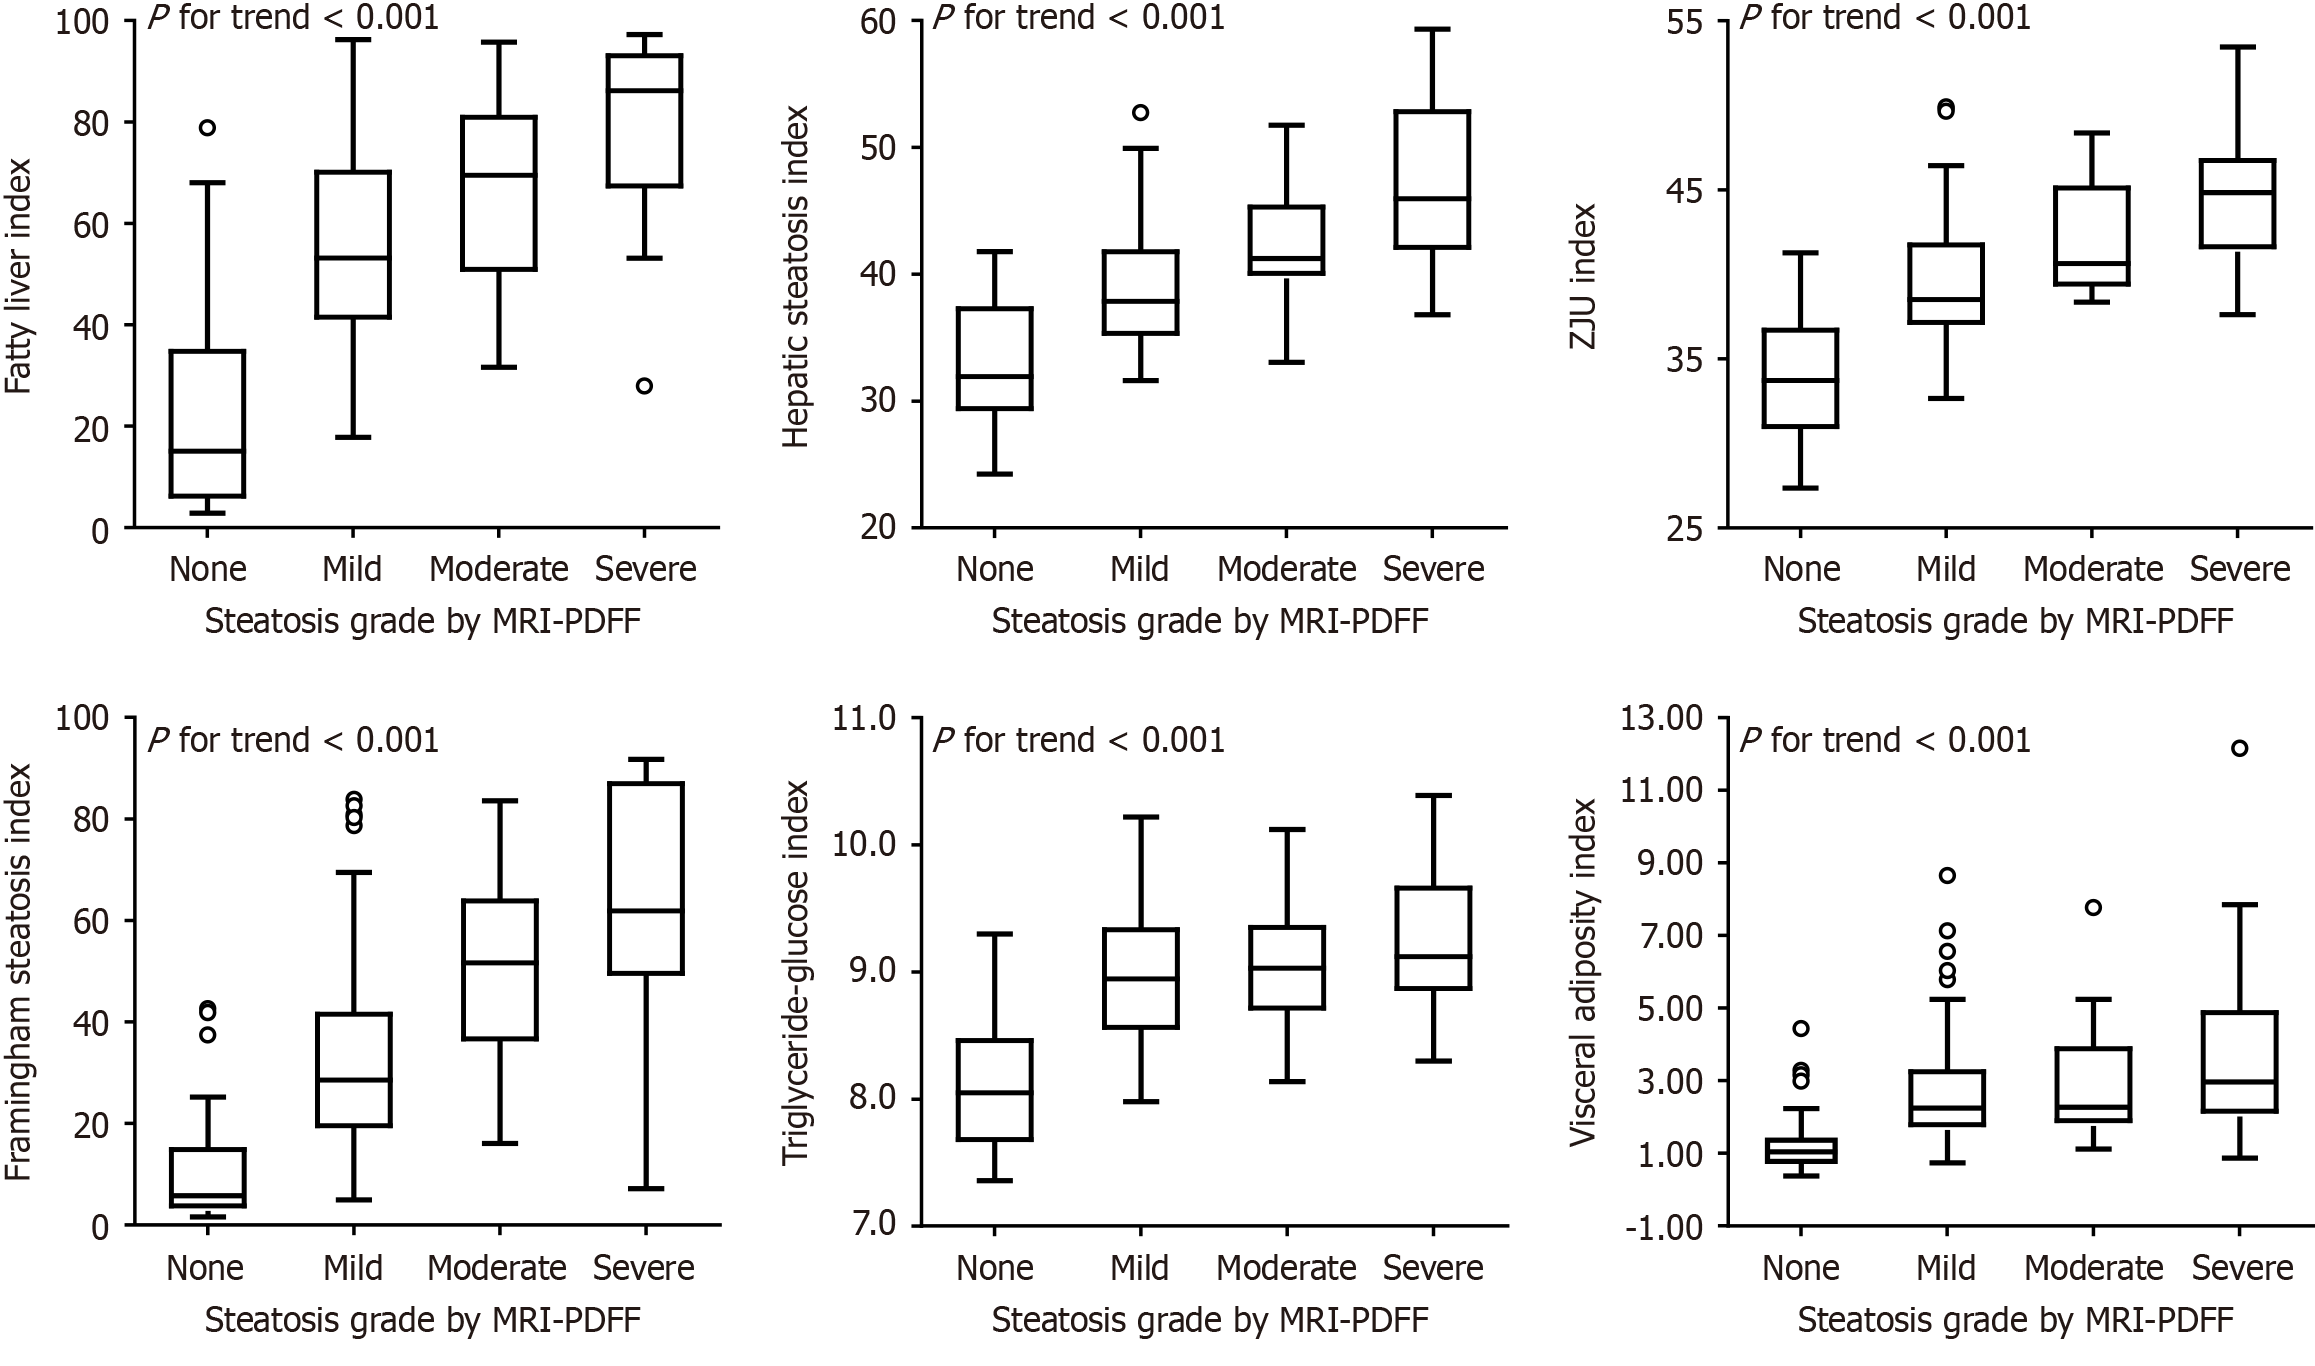
Figure 2 Distribution of each steatosis biomarkers according to steatosis grades as determined by magnetic resonance imaging proton density fat fraction.
The box represents the interquartile range. The black line across the box represents the median. The whiskers represent the maximum and minimum values, excluding outliers (dots). P for trend was determined by one-way analysis of variance for trend analysis or Jonchheere-Terpstra trend test. MRI-PDFF: Magnetic resonance imaging proton density fat fraction.
- Citation: Chen JL, Duan SJ, Xie S, Yao SK. Diagnostic accuracy of noninvasive steatosis biomarkers with magnetic resonance imaging proton density fat fraction as gold standard. World J Radiol 2025; 17(5): 104272
- URL: https://www.wjgnet.com/1949-8470/full/v17/i5/104272.htm
- DOI: https://dx.doi.org/10.4329/wjr.v17.i5.104272


