
















©The Author(s) 2025.
World J Radiol. Dec 28, 2025; 17(12): 114595
Published online Dec 28, 2025. doi: 10.4329/wjr.v17.i12.114595
Published online Dec 28, 2025. doi: 10.4329/wjr.v17.i12.114595
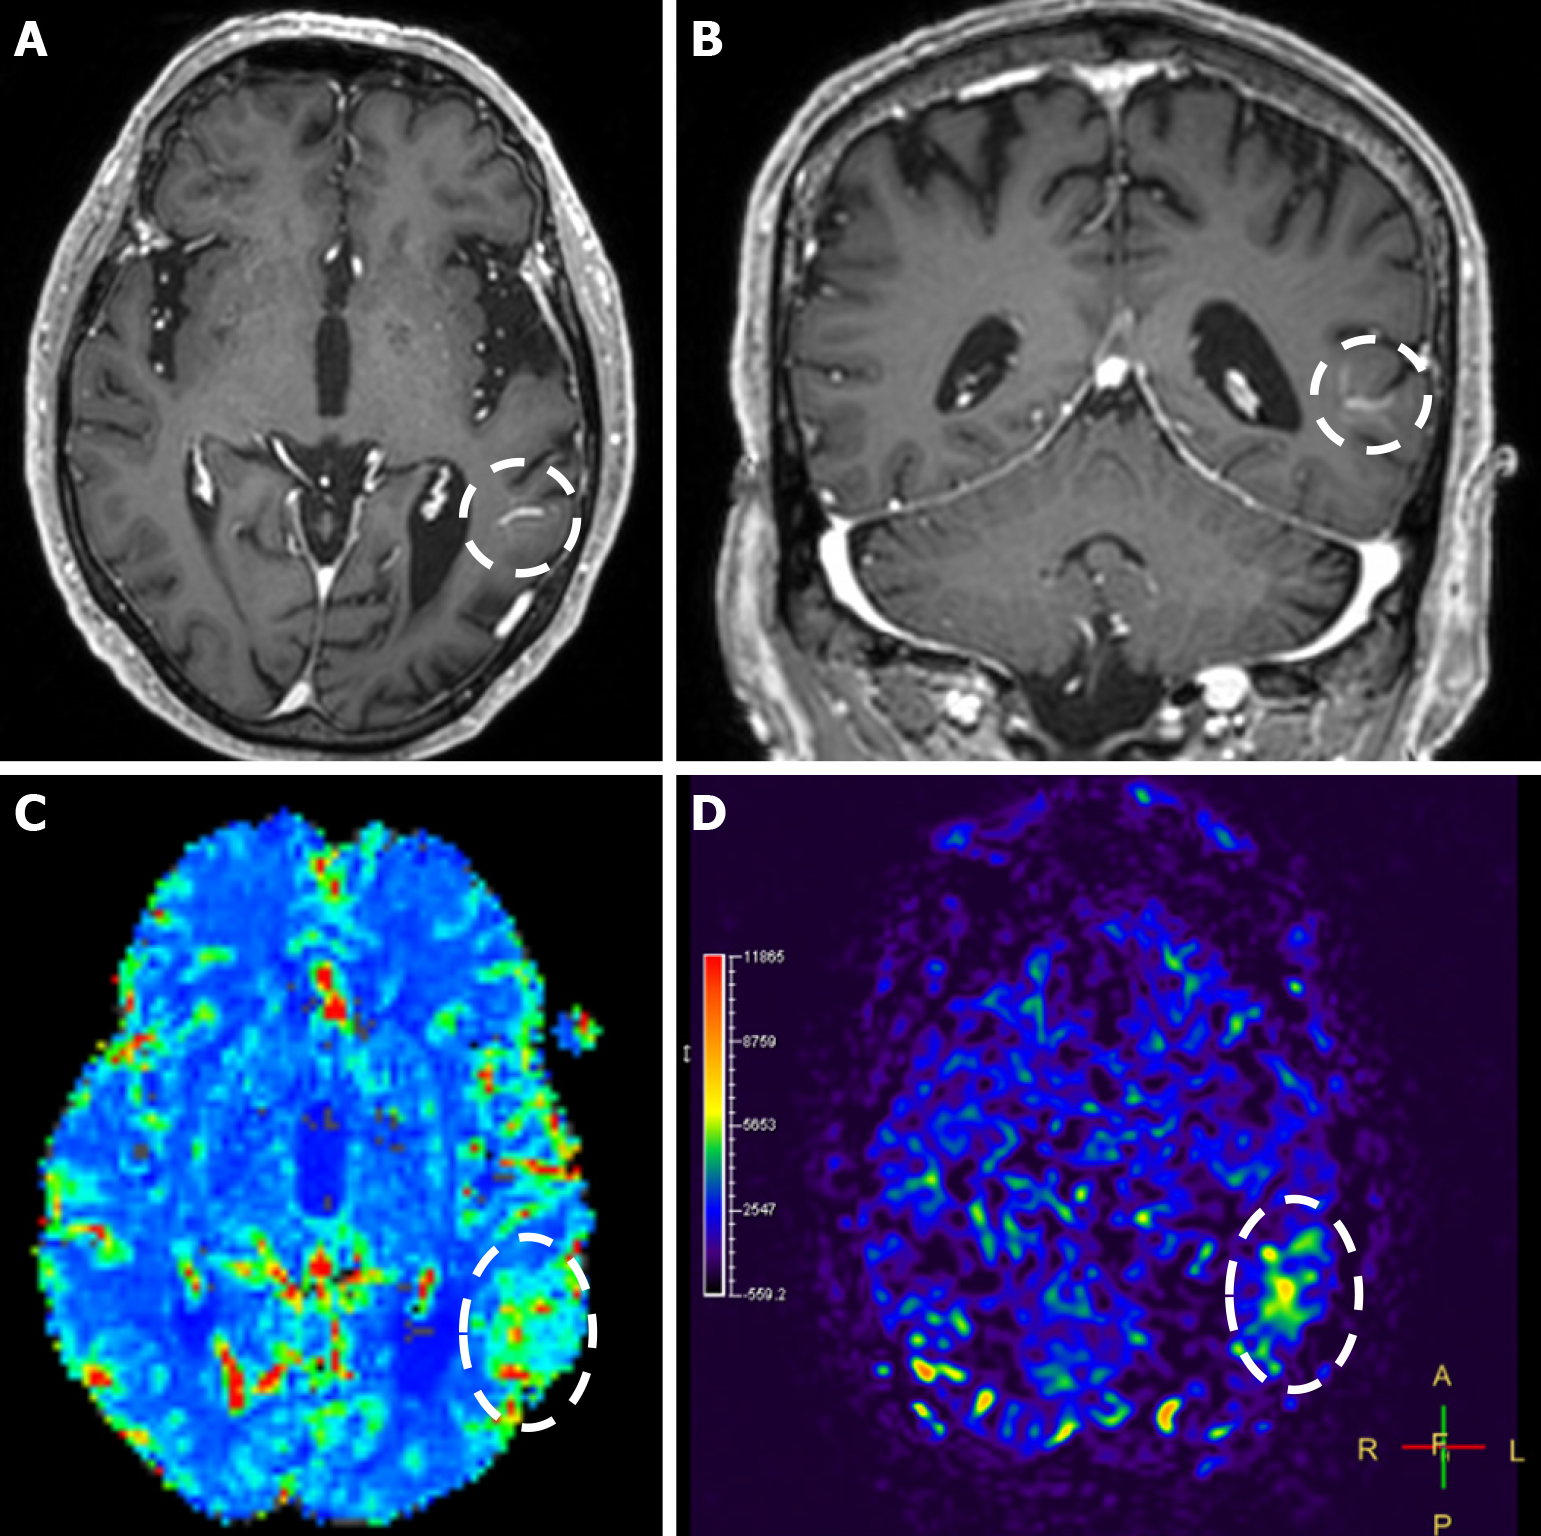
Figure 3 Developmental venous anomaly image.
A and B: T1-weighted axial (A) and coronal (B) images following intravenous gadolinium administration demonstrate a developmental venous anomaly in the left temporal lobe, evident by the characteristic “caput medusae” appearance and the draining vein (dashed circle); C and D: When compared to the contralateral side, dynamic susceptibility contrast magnetic resonance perfusion demonstrates increased relative cerebral blood volume (C), and arterial spin-labeling perfusion displays increased relative cerebral blood flow (D) (dashed oval) in the corresponding territory of the developmental venous anomaly.
- Citation: Arkoudis NA, Siderakis M, Tsetsou I, Efthymiou E, Triantafyllou G, Chalmoukis D, Karachaliou A, Papadopoulos A, Prountzos S, Moschovaki-Zeiger O, Gouliopoulos N, Papakonstantinou O, Filippiadis D, Velonakis G. Developmental venous anomalies and cerebral cavernous malformations: Partners in crime. World J Radiol 2025; 17(12): 114595
- URL: https://www.wjgnet.com/1949-8470/full/v17/i12/114595.htm
- DOI: https://dx.doi.org/10.4329/wjr.v17.i12.114595