
















©The Author(s) 2025.
World J Radiol. Dec 28, 2025; 17(12): 112986
Published online Dec 28, 2025. doi: 10.4329/wjr.v17.i12.112986
Published online Dec 28, 2025. doi: 10.4329/wjr.v17.i12.112986
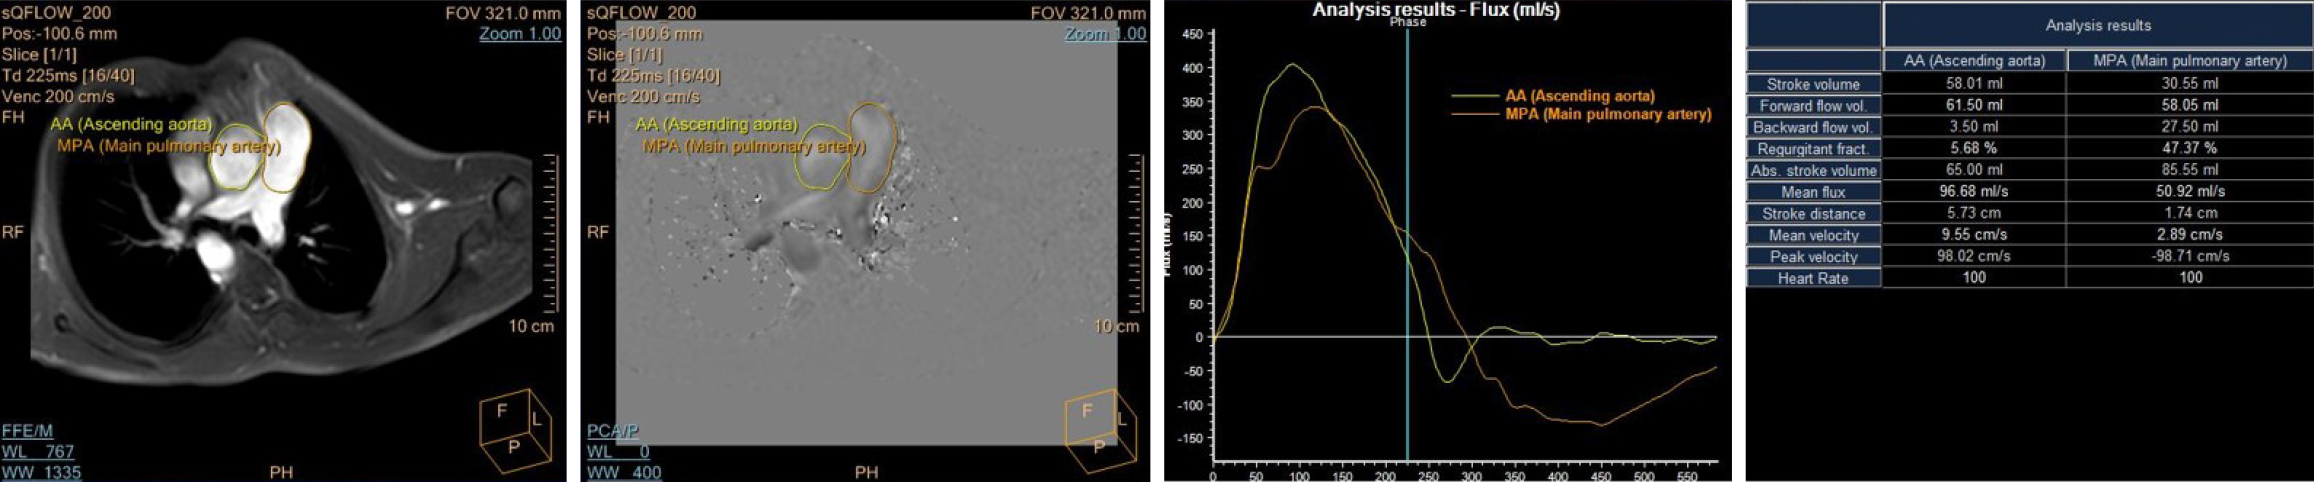
Figure 11 Cardiac magnetic resonance imaging to calculate Qp:Qs.
Regions of interest are placed in the aorta and main pulmonary artery (yellow and orange circles, respectively), and phase-contrast magnetic resonance imaging is performed. The graph shows the quantity and directions of flow at these levels. The flow parameters and Qp:Qs are shown in the system-generated table.
- Citation: Sharma A, Subramanian P, Soundararajan R, Maralakunte M, Mallick A, Debi U, Jaswal V, Manoj Kumar R, Singhal M. Imaging considerations in tetralogy of Fallot: A comprehensive review. World J Radiol 2025; 17(12): 112986
- URL: https://www.wjgnet.com/1949-8470/full/v17/i12/112986.htm
- DOI: https://dx.doi.org/10.4329/wjr.v17.i12.112986