
















©The Author(s) 2025.
World J Radiol. Dec 28, 2025; 17(12): 112986
Published online Dec 28, 2025. doi: 10.4329/wjr.v17.i12.112986
Published online Dec 28, 2025. doi: 10.4329/wjr.v17.i12.112986
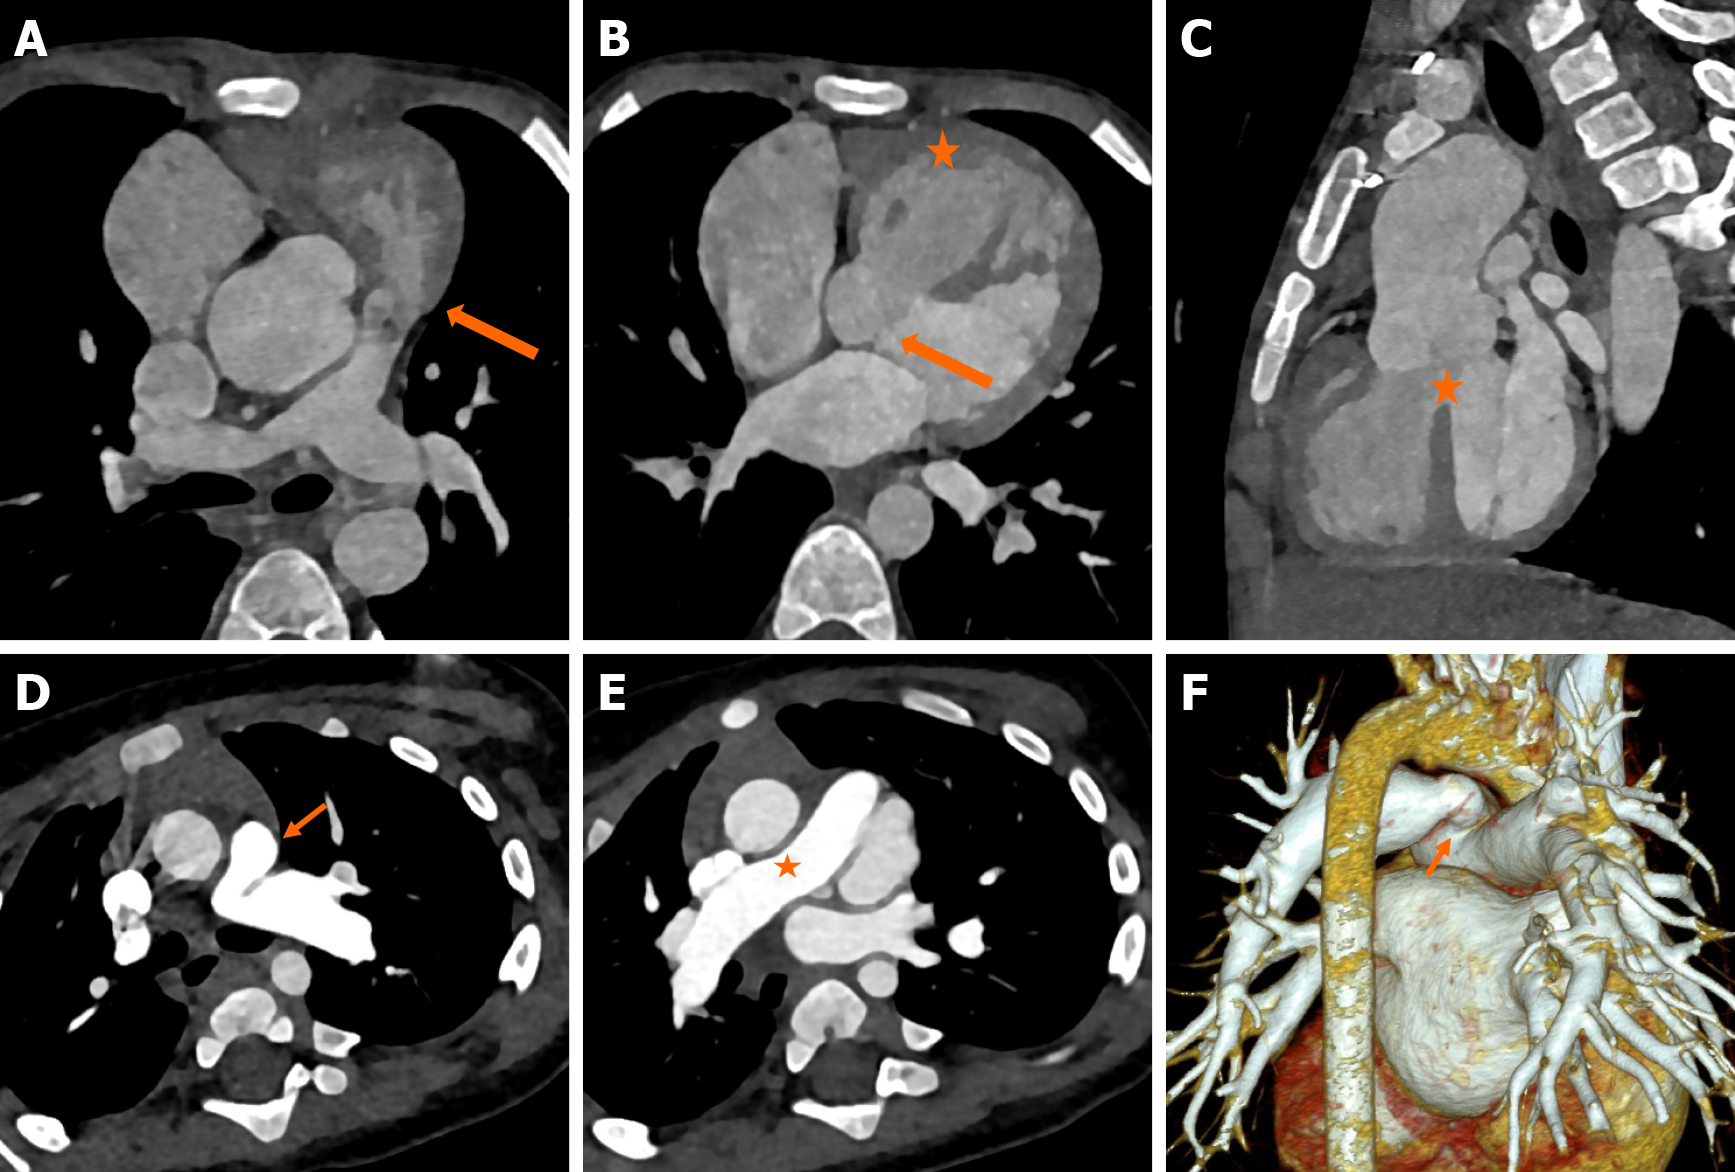
Figure 5 Computed tomography images.
A-C: Axial (A and B) and sagittal reformatted images (C) of computed tomography angiography in a child with cyanosis, showing infundibular pulmonary stenosis (block arrow in A), right ventricular hypertrophy (asterisk in B), perimembranous ventricular septal defect (block arrow in B) with 50% aortic override (asterisk in C) consistent with classical tetralogy of Fallot; D-F: Axial (D and E) images showing stenosis at the origin of the left pulmonary artery (arrow). The right pulmonary artery was normal (asterisk); F: Three-dimensional volume rendered image showing the left pulmonary artery stenosis (arrow).
- Citation: Sharma A, Subramanian P, Soundararajan R, Maralakunte M, Mallick A, Debi U, Jaswal V, Manoj Kumar R, Singhal M. Imaging considerations in tetralogy of Fallot: A comprehensive review. World J Radiol 2025; 17(12): 112986
- URL: https://www.wjgnet.com/1949-8470/full/v17/i12/112986.htm
- DOI: https://dx.doi.org/10.4329/wjr.v17.i12.112986