
















©The Author(s) 2025.
World J Radiol. Dec 28, 2025; 17(12): 112911
Published online Dec 28, 2025. doi: 10.4329/wjr.v17.i12.112911
Published online Dec 28, 2025. doi: 10.4329/wjr.v17.i12.112911
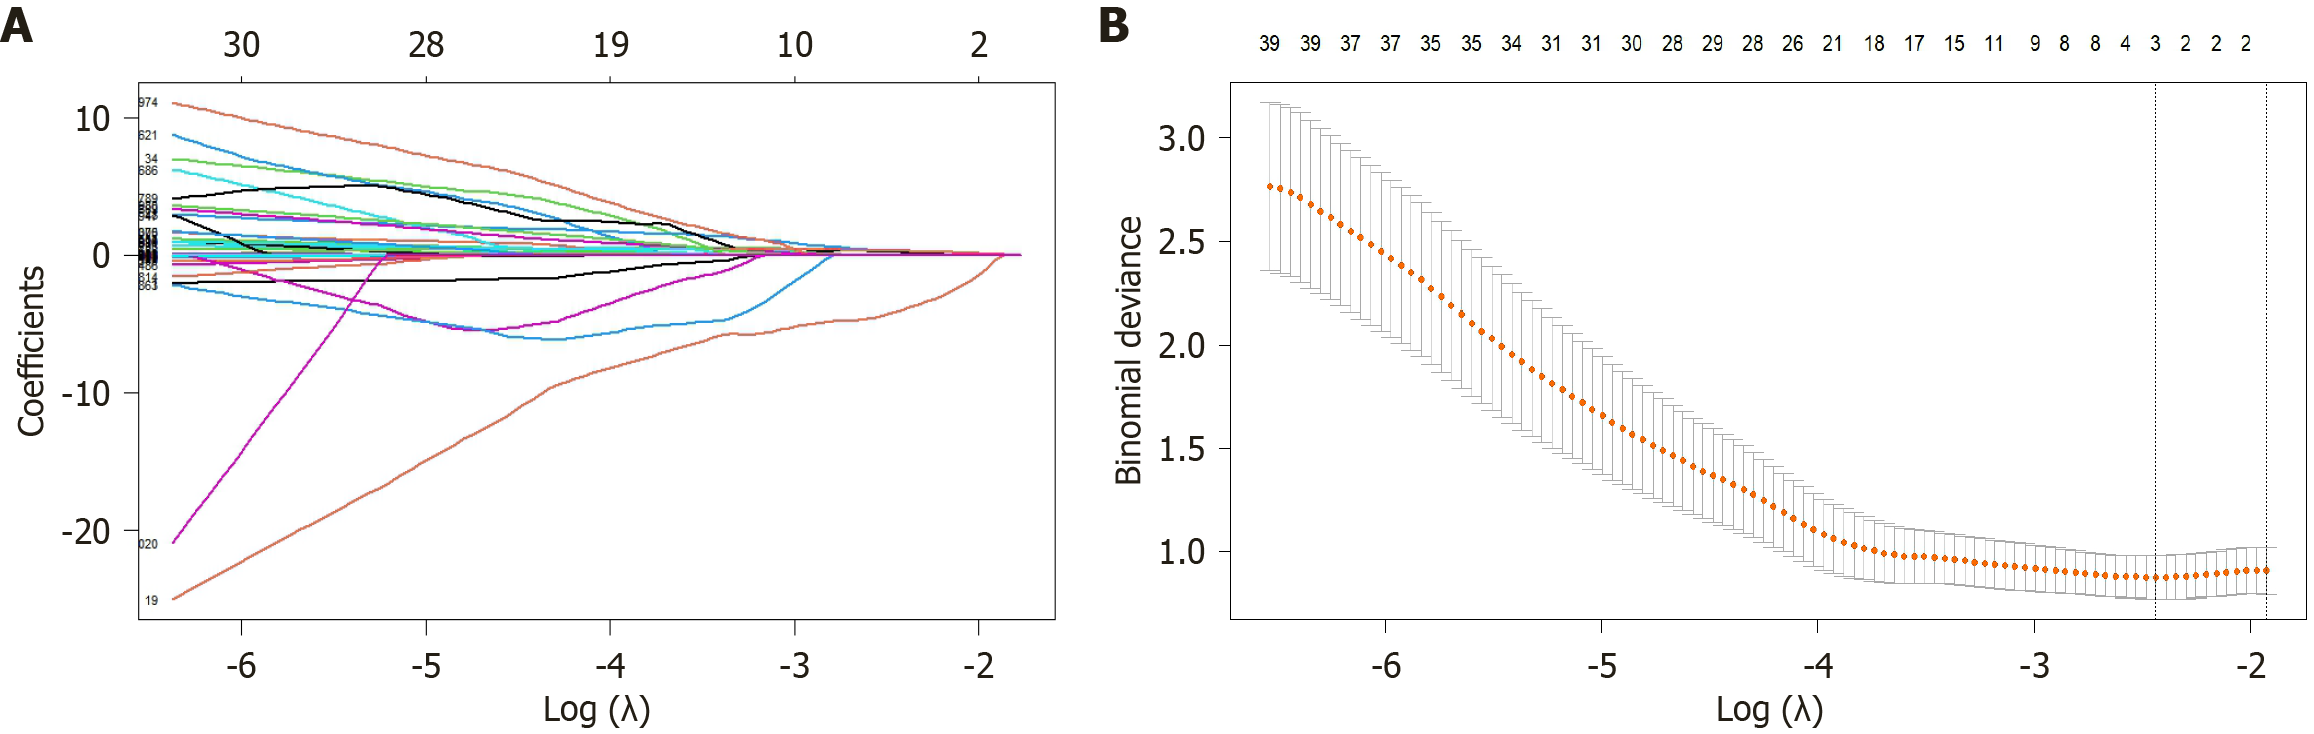
Figure 4 Radiomics features screened via least absolute selection and shrinkage operator regression.
The vertical axis shows the model misclassification rate. The horizontal axis shows log(λ). The two vertical lines were drawn at the selected values using cross-validation, and the optimal values were obtained by applying the minimum criteria and 1 of the minimum criteria (1-standard error criteria). A: Coefficient change spectra of the radiomics features; B: The process of feature selection for determining the parameter (λ) in the least absolute selection and shrinkage operator model by 10-fold cross-validation.
- Citation: Shi Y, Zhang P, Li L, Yang HM, Li ZM, Zheng J, Yang L. Interpretable model based on multisequence magnetic resonance imaging radiomics for predicting the pathological grades of hepatocellular carcinomas. World J Radiol 2025; 17(12): 112911
- URL: https://www.wjgnet.com/1949-8470/full/v17/i12/112911.htm
- DOI: https://dx.doi.org/10.4329/wjr.v17.i12.112911