Copyright
©The Author(s) 2023.
World J Radiol. Apr 28, 2023; 15(4): 98-117
Published online Apr 28, 2023. doi: 10.4329/wjr.v15.i4.98
Published online Apr 28, 2023. doi: 10.4329/wjr.v15.i4.98
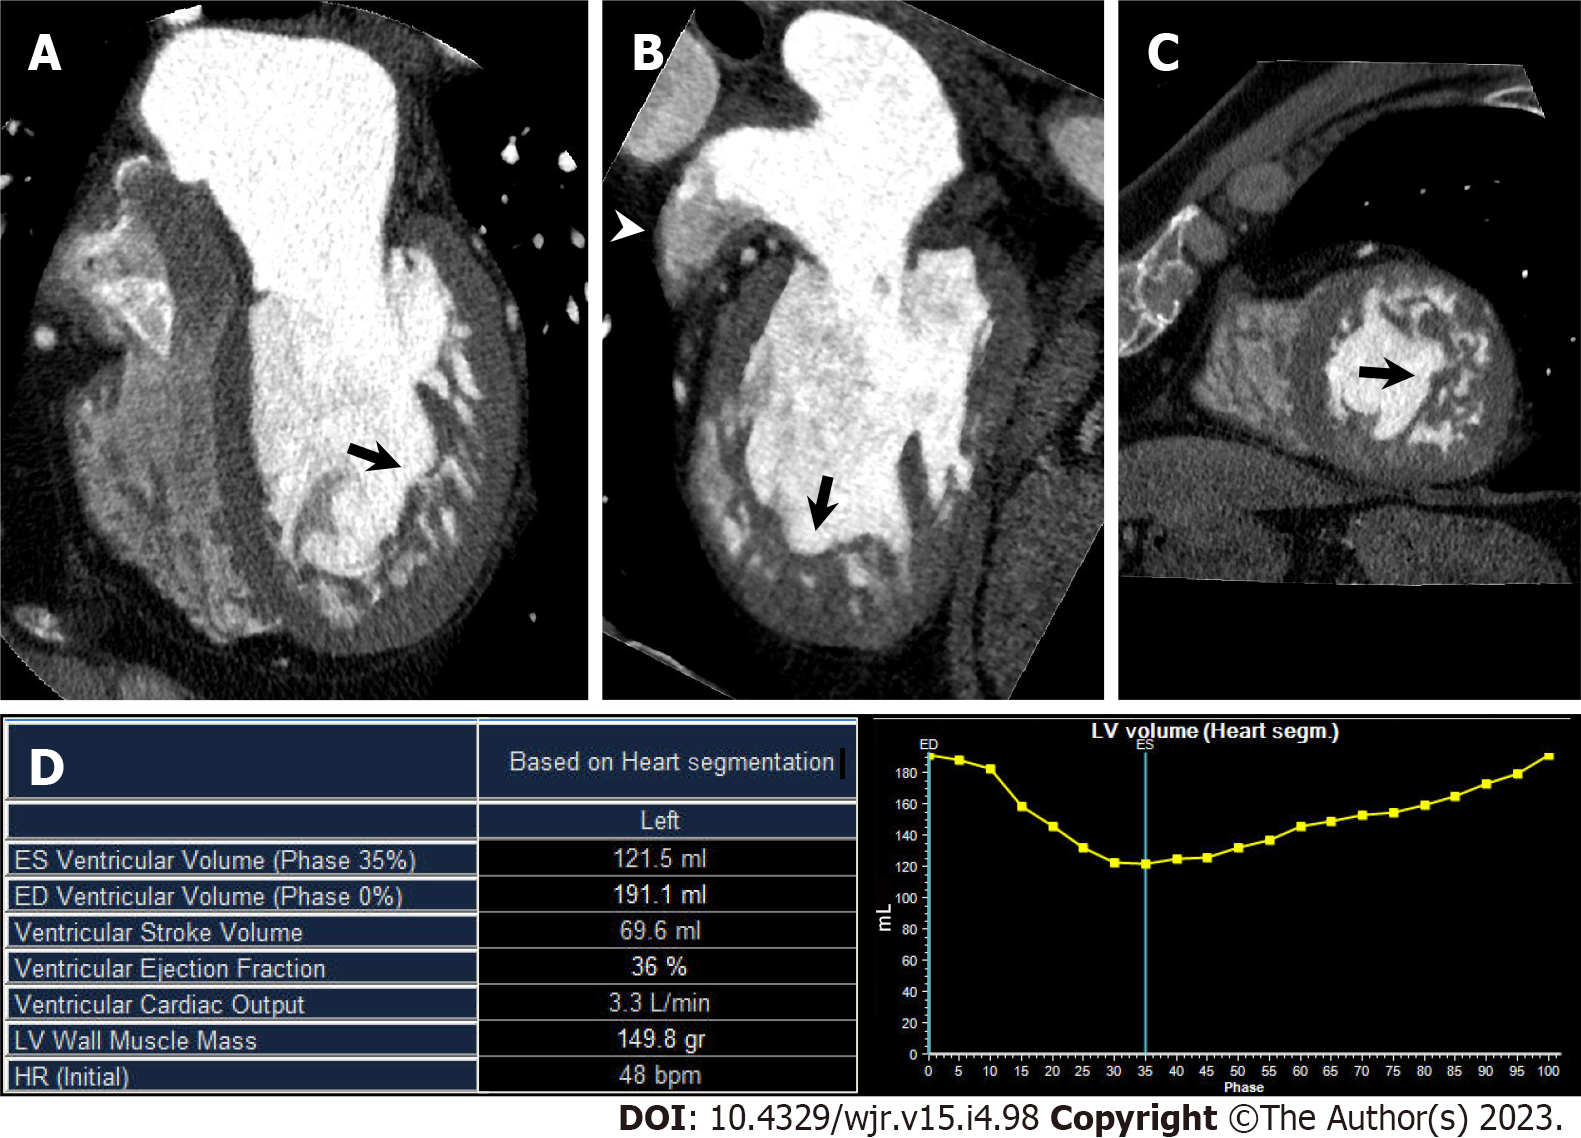
Figure 7 Left ventricular noncompaction.
A 60-year-old man with congestive heart failure underwent cardiac computed tomography (CCT) in search of underlying heart disease. A–C Horizontal long axis (A), vertical long axis (B), and short axis (C) reformatted CCT images show increased trabeculations from mid to apical portion of left ventricle (arrows). Noncompacted-to-compacted layer ratio at end-diastolic was 2.6. Note contrast heterogeneity within left atrial appendage (LAA), which reflects blood stasis in LAA (arrowhead); D: Left ventricular (LV) functional analysis shows impaired LV function. LV end-diastolic volume, end-systolic volume, and ejection fraction were 191.1 mL, 121.5 mL, and 36%, respectively.
- Citation: Yoshihara S. Evaluation of causal heart diseases in cardioembolic stroke by cardiac computed tomography. World J Radiol 2023; 15(4): 98-117
- URL: https://www.wjgnet.com/1949-8470/full/v15/i4/98.htm
- DOI: https://dx.doi.org/10.4329/wjr.v15.i4.98


