Copyright
©The Author(s) 2021.
World J Radiol. Sep 28, 2021; 13(9): 258-282
Published online Sep 28, 2021. doi: 10.4329/wjr.v13.i9.258
Published online Sep 28, 2021. doi: 10.4329/wjr.v13.i9.258
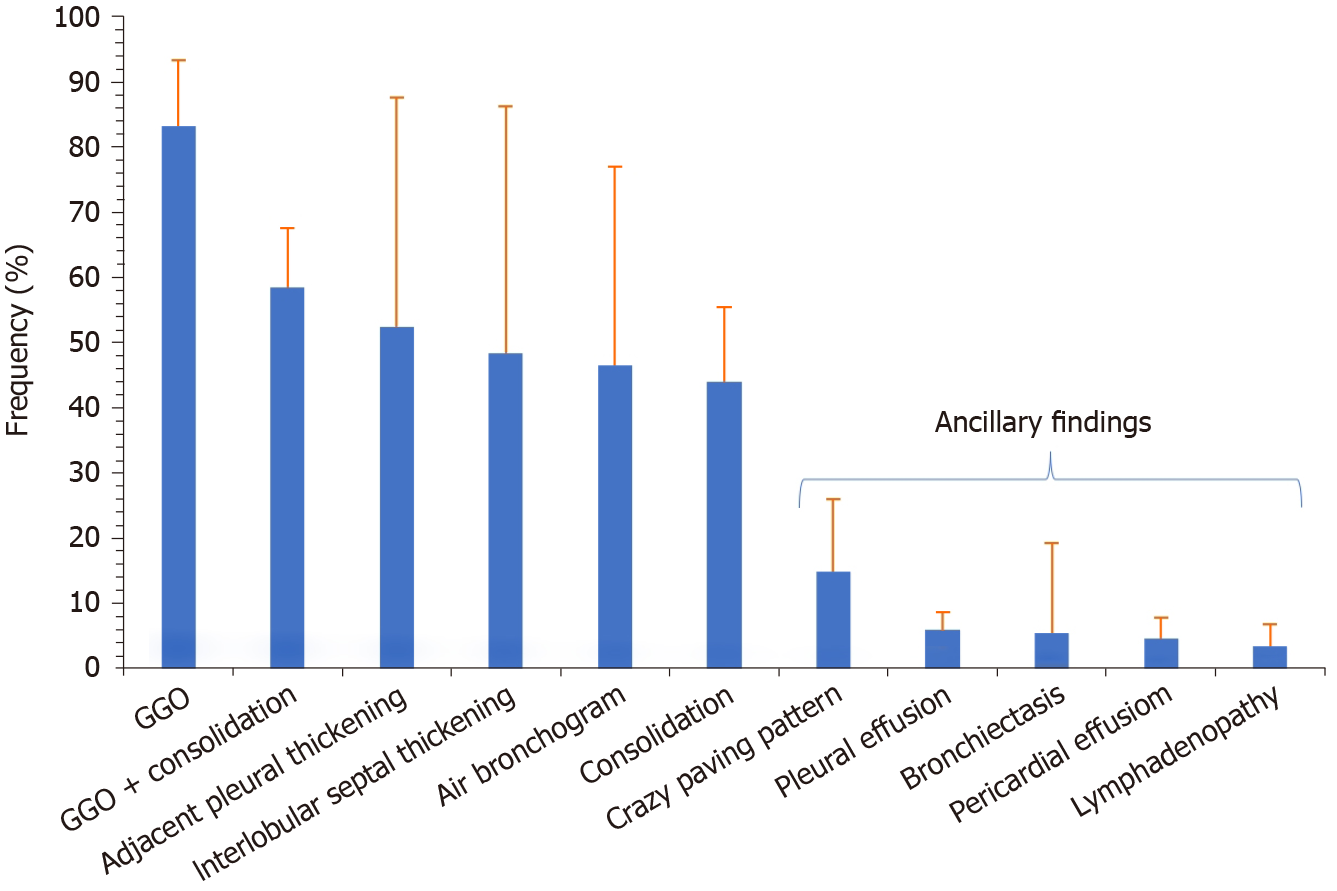
Figure 3 Summary of the frequency distribution of classical and ancillary computed tomography imaging findings in coronavirus disease 2019 pneumonia.
The whiskers indicate the 95% confidence interval. GGO: Ground-glass opacity.
- Citation: Pal A, Ali A, Young TR, Oostenbrink J, Prabhakar A, Prabhakar A, Deacon N, Arnold A, Eltayeb A, Yap C, Young DM, Tang A, Lakshmanan S, Lim YY, Pokarowski M, Kakodkar P. Comprehensive literature review on the radiographic findings, imaging modalities, and the role of radiology in the COVID-19 pandemic. World J Radiol 2021; 13(9): 258-282
- URL: https://www.wjgnet.com/1949-8470/full/v13/i9/258.htm
- DOI: https://dx.doi.org/10.4329/wjr.v13.i9.258


