Copyright
©The Author(s) 2018.
World J Radiol. Sep 28, 2018; 10(9): 91-99
Published online Sep 28, 2018. doi: 10.4329/wjr.v10.i9.91
Published online Sep 28, 2018. doi: 10.4329/wjr.v10.i9.91
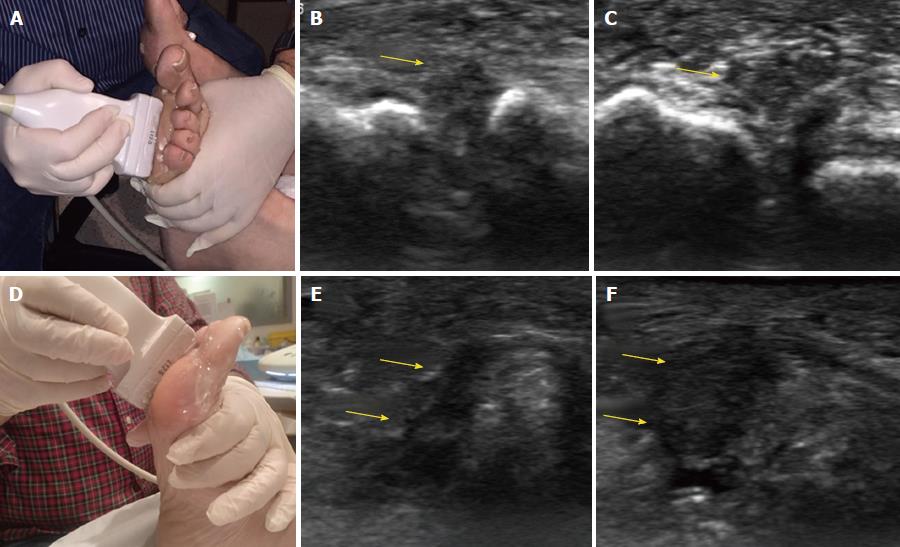
Figure 3 Ultrasound imaging of Morton’s neuroma.
A: Clasping of the forefoot in the short axis view; B, C: Short axis views of the intermetatarsal space before (B) and after (C) squeezing the forefoot; D: Clasping of the forefoot in the long axis view; E, F: Long axis views of the intermetatarsal space before (E) and after (F) squeezing the forefoot. In all images, arrows indicate Morton’s neuroma.
- Citation: Santiago FR, Muñoz PT, Pryest P, Martínez AM, Olleta NP. Role of imaging methods in diagnosis and treatment of Morton’s neuroma. World J Radiol 2018; 10(9): 91-99
- URL: https://www.wjgnet.com/1949-8470/full/v10/i9/91.htm
- DOI: https://dx.doi.org/10.4329/wjr.v10.i9.91


