Copyright
©2009 Baishideng Publishing Group Co.
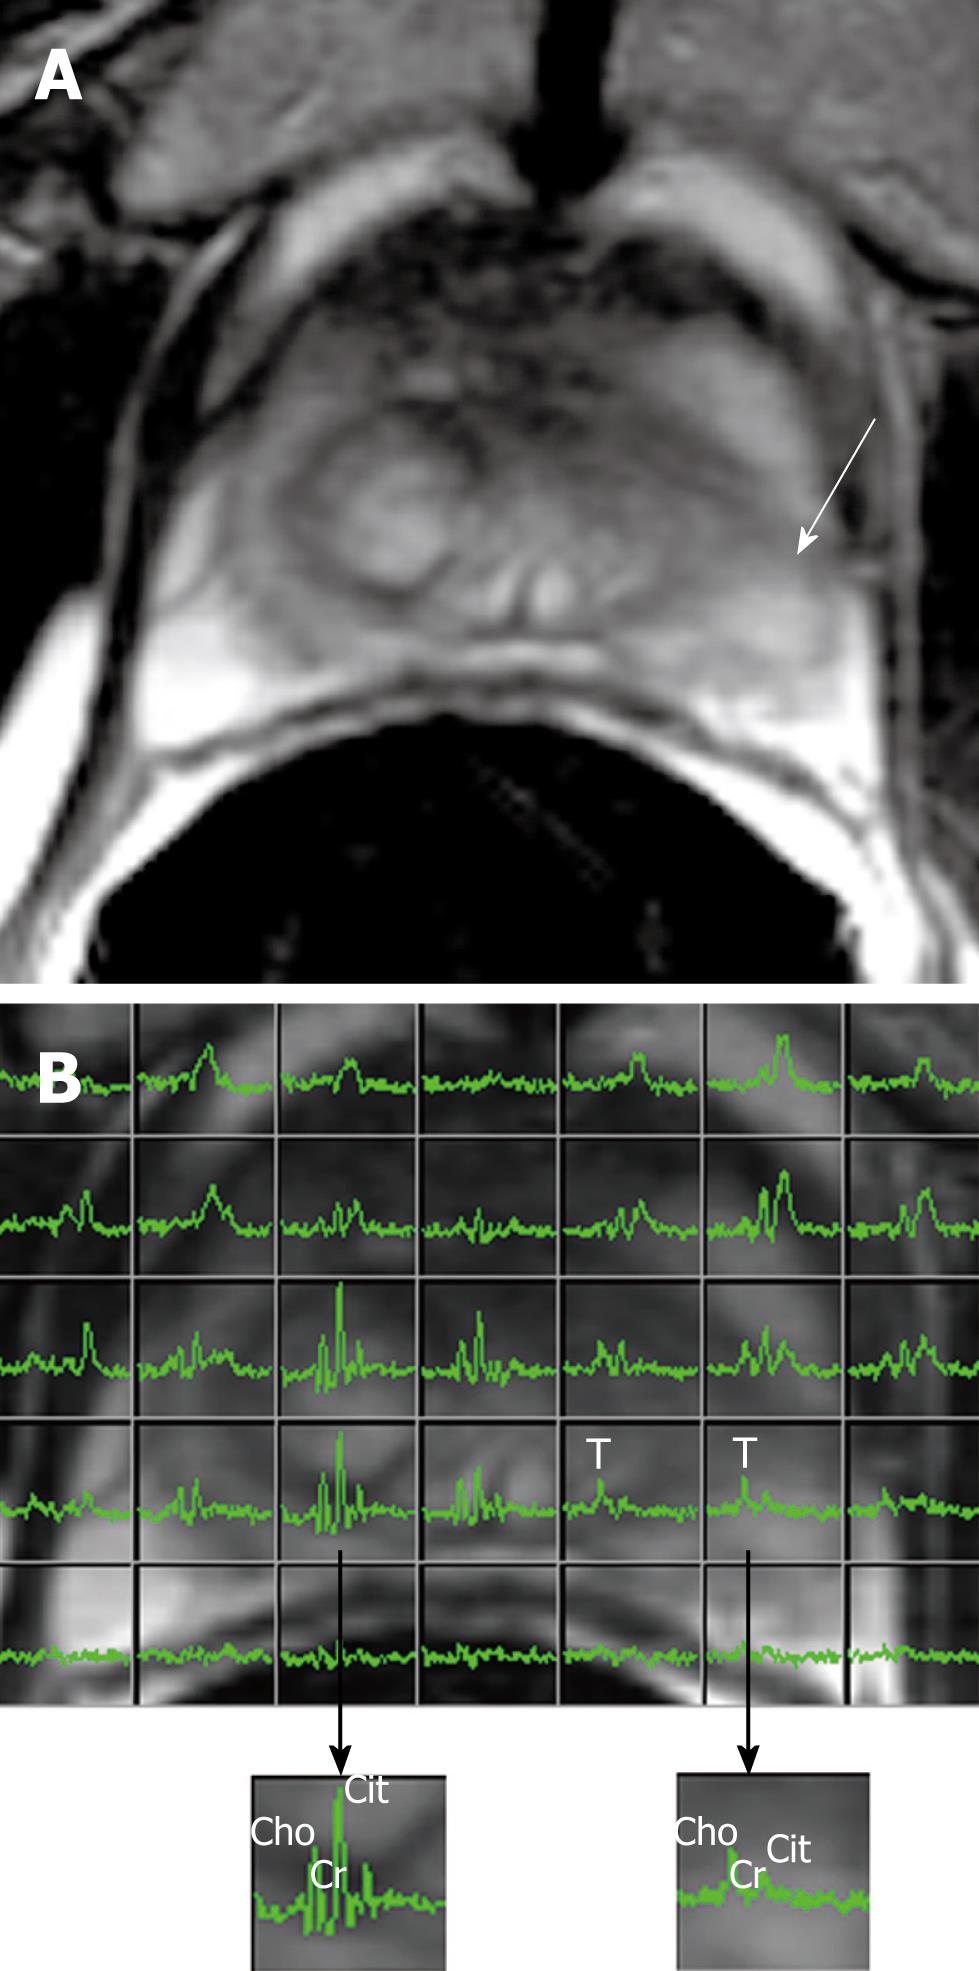
Figure 2 Prostate cancer in a 65-year-old patient with PSA level of 4.
76 ng/mL. Transverse T2-weighted MR image (WI) (A) and corresponding MR spectroscopic imaging (MRSI) grid (B) superimposed on the anatomic image show the tumor (arrow) on the left apex. MRSI demonstrates reduced citrate and elevated choline in the left peripheral zone tumor (T) and normal spectra in the healthy right peripheral area. Cho: Choline; Cr: Creatine; Cit: Citrate.
- Citation: Wang L. Incremental value of magnetic resonance imaging in the advanced management of prostate cancer. World J Radiol 2009; 1(1): 3-14
- URL: https://www.wjgnet.com/1949-8470/full/v1/i1/3.htm
- DOI: https://dx.doi.org/10.4329/wjr.v1.i1.3


