Copyright
©The Author(s) 2017.
World J Radiol. Mar 28, 2017; 9(3): 134-142
Published online Mar 28, 2017. doi: 10.4329/wjr.v9.i3.134
Published online Mar 28, 2017. doi: 10.4329/wjr.v9.i3.134
Figure 1 Representative 1.
5T magnetic resonance imaging/magnetic resonance spectroscopic imaging in a 58-year-old patient with prostate specific antigen 96.53 ng/mL, clinical stage T3 and surgical Gleason score 4 + 5. A: Axial T2-weighted image and overlaid point-resolved spectroscopic box indicating excitation region selected and 3D MRSI demonstrating three suspicious voxels marked with asterisks; B: 18F-FDG-PET/CT fusion image shows a focal uptake in the left prostate; C: Whole-mount step-section histopathology after radical prostatectomy shows a large cancer in the left prostate. MRSI: Magnetic resonance spectroscopic imaging; 18F-FDG-PET/CT: 18F-fluorodeoxyglucose positron emission tomography/computed tomography.
Figure 2 Representative 1.
5T magnetic resonance imaging/magnetic resonance spectroscopic imaging in a 64-year-old patient with prostate specific antigen 4.9 ng/mL, clinical stage T3 and surgical Gleason score 4 + 3. A: Axial T2-weighted image and overlaid point-resolved spectroscopic box indicating excitation region selected and 3D MRSI demonstrating ten suspicious voxels marked with asterisks; B: 18F-FDG-PET/CT fusion image shows no focal uptake in the prostate; C: Whole-mount step-section histopathology after radical prostatectomy shows a large cancer extending from medial to right side of the prostate. MRSI: Magnetic resonance spectroscopic imaging; 18F-FDG-PET/CT: 18F-fluorodeoxyglucose positron emission tomography/computed tomography.
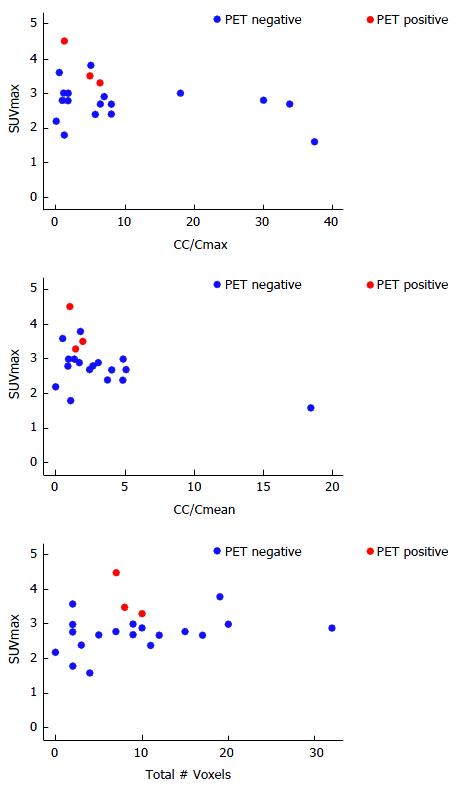
Figure 3 Scatter plots demonstrating the relationships between proton magnetic resonance spectroscopic imaging and 18F-fluorodeoxyglucose positron emission tomography parameters (n = 22).
PET: Positron emission tomography.
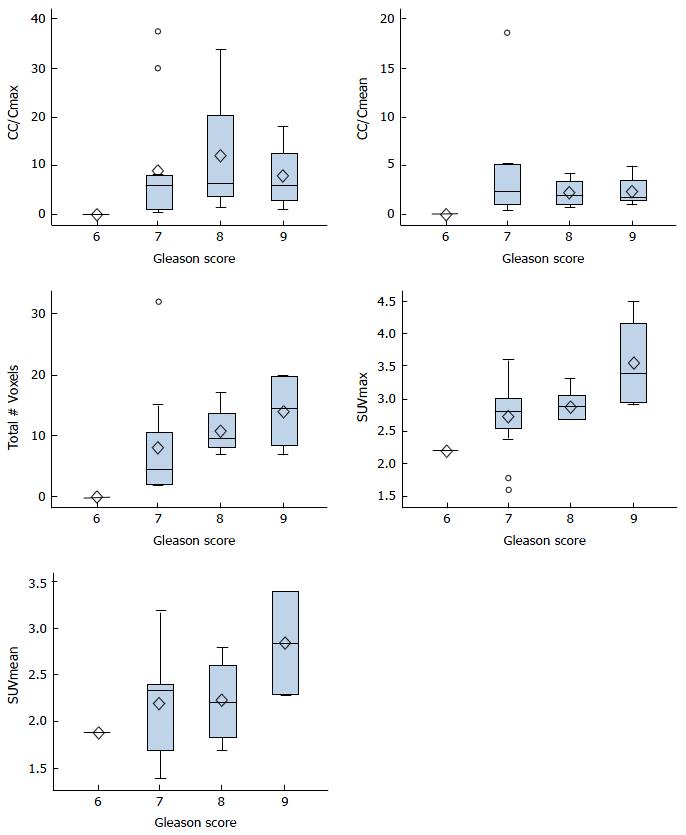
Figure 4 Box plots demonstrating the relationships between surgical Gleason score and imaging parameters (n = 22).
- Citation: Shukla-Dave A, Wassberg C, Pucar D, Schöder H, Goldman DA, Mazaheri Y, Reuter VE, Eastham J, Scardino PT, Hricak H. Multimodality imaging using proton magnetic resonance spectroscopic imaging and 18F-fluorodeoxyglucose-positron emission tomography in local prostate cancer. World J Radiol 2017; 9(3): 134-142
- URL: https://www.wjgnet.com/1949-8470/full/v9/i3/134.htm
- DOI: https://dx.doi.org/10.4329/wjr.v9.i3.134


