Copyright
©2014 Baishideng Publishing Group Inc.
World J Radiol. Aug 28, 2014; 6(8): 625-628
Published online Aug 28, 2014. doi: 10.4329/wjr.v6.i8.625
Published online Aug 28, 2014. doi: 10.4329/wjr.v6.i8.625
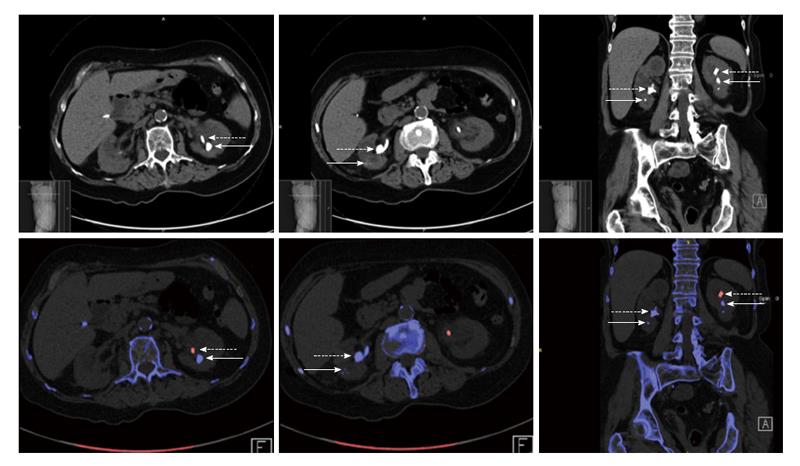
Figure 1 Conventional and dual-energy computed tomography images of kidney stones and ureteral stents.
Conventional computed tomography (top) and dual-energy computed-tomography (DECT, bottom) images showing the advantage of DECT for stone visualization and identification of composition. The solid and dashed arrows point to stones and stents, respectively. The different stent and stone colors in the left kidney enhanced stone visualization, while the visualization of the stone in the right kidney is compromised because it has the same color as the stent. The small cubes in the bottom show the view orientation in the 3D [Anterior (A); and Foot (F)].
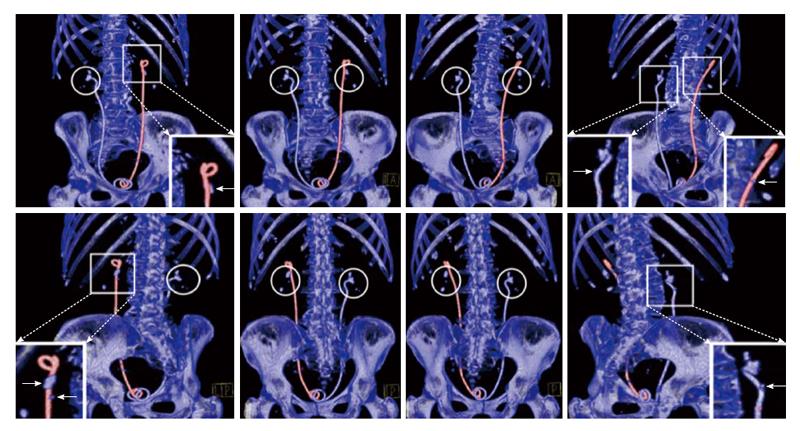
Figure 2 Three-dimensional reconstruction of dual-energy computed tomography images of kidney stones and different types of ureteral stents.
Different views of the stent/stone boundary from three-dimensional reconstruction of the dual-energy computed-tomography images. The left and right stents appear red and blue, respectively, while all stones appear blue due to their non-uric-acid composition. The different colors of the stent and stone in the left kidney allow for better stone visualization (arrows) than in the right kidney where both the stent and stone have the same color. [Anterior (A)-Posterior (P); and Left (L)]
- Citation: Ibrahim ESH, Haley WE, Jepperson MA, Wehle MJ, Cernigliaro JG. Characterization of ureteral stents by dual-energy computed tomography: Clinical implications. World J Radiol 2014; 6(8): 625-628
- URL: https://www.wjgnet.com/1949-8470/full/v6/i8/625.htm
- DOI: https://dx.doi.org/10.4329/wjr.v6.i8.625


