Copyright
©The Author(s) 2021.
World J Radiol. Aug 28, 2021; 13(8): 243-257
Published online Aug 28, 2021. doi: 10.4329/wjr.v13.i8.243
Published online Aug 28, 2021. doi: 10.4329/wjr.v13.i8.243
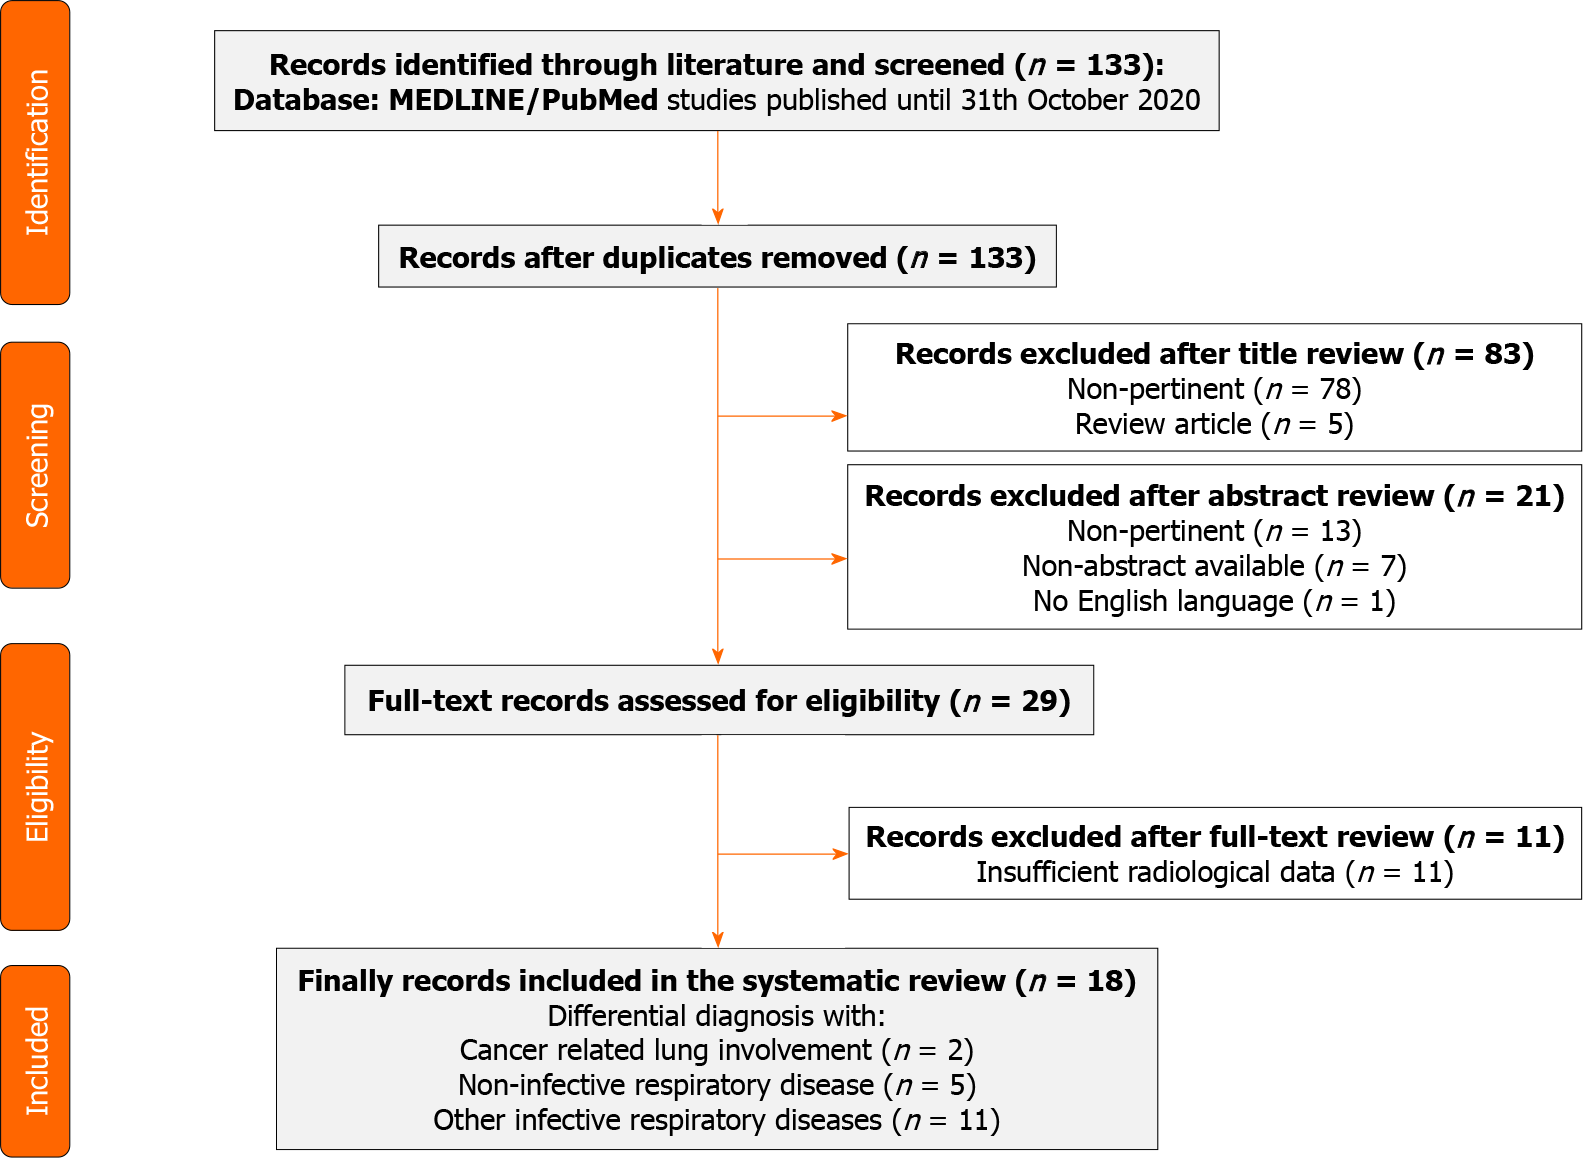
Figure 1 PRISMA flow diagram.
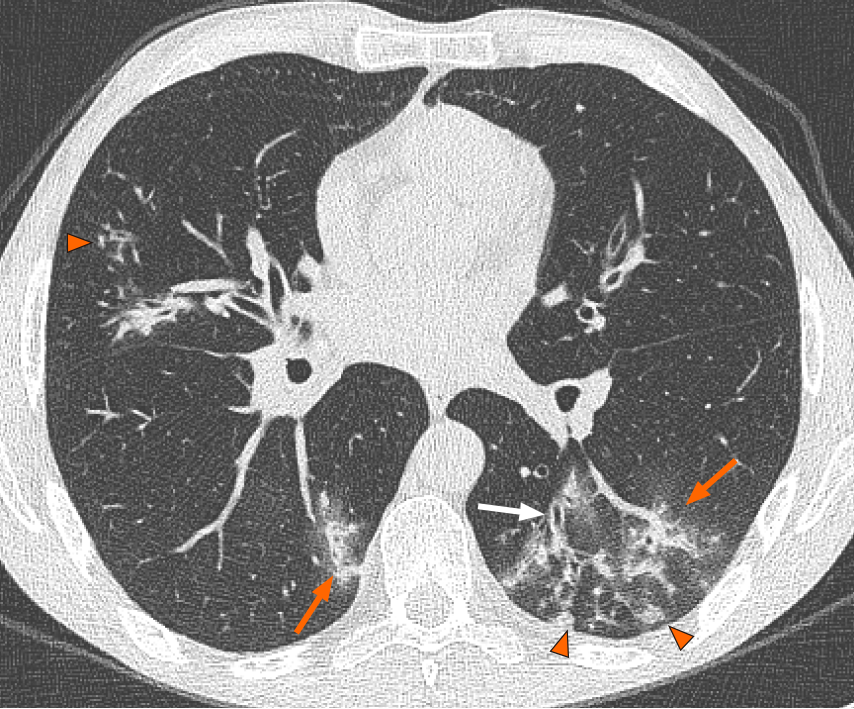
Figure 2 Axial computed tomography image of a 36-year-old man shows nodular (arrowheads) and peribronchovascular branching (orange arrows) opacities along with bronchial wall thickening (white arrow), which suggest a diagnosis other than coronavirus disease 2019 pneumonia.
The patient was diagnosed with Mycoplasma pneumoniae pneumonia.
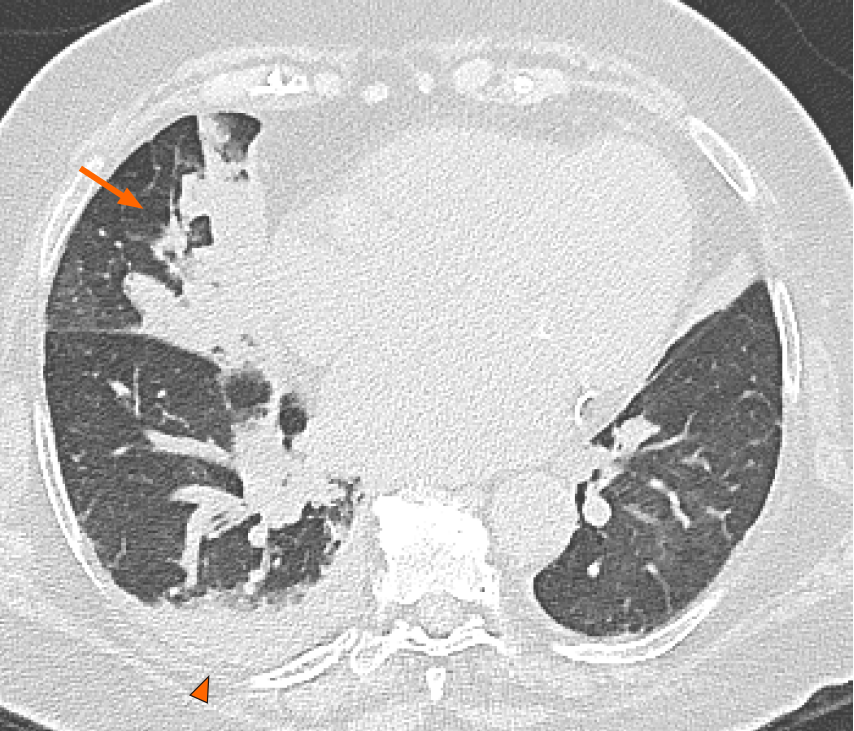
Figure 3 Axial computed tomography image shows right lung consolidation (arrow) and unilateral pleural effusion (arrowhead) in a 64-year-old man with bacterial pneumonia.
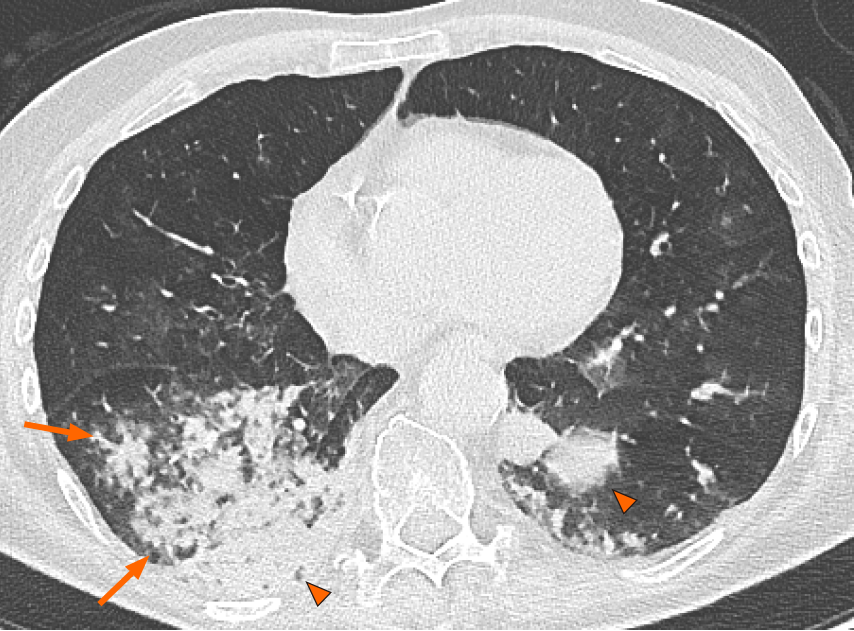
Figure 4 Axial computed tomography image in a 50-year-old woman diagnosed with bronchopneumonia shows confluent centrilobular nodules (arrows) and consolidation (arrowheads) mostly located in the lower lobes.
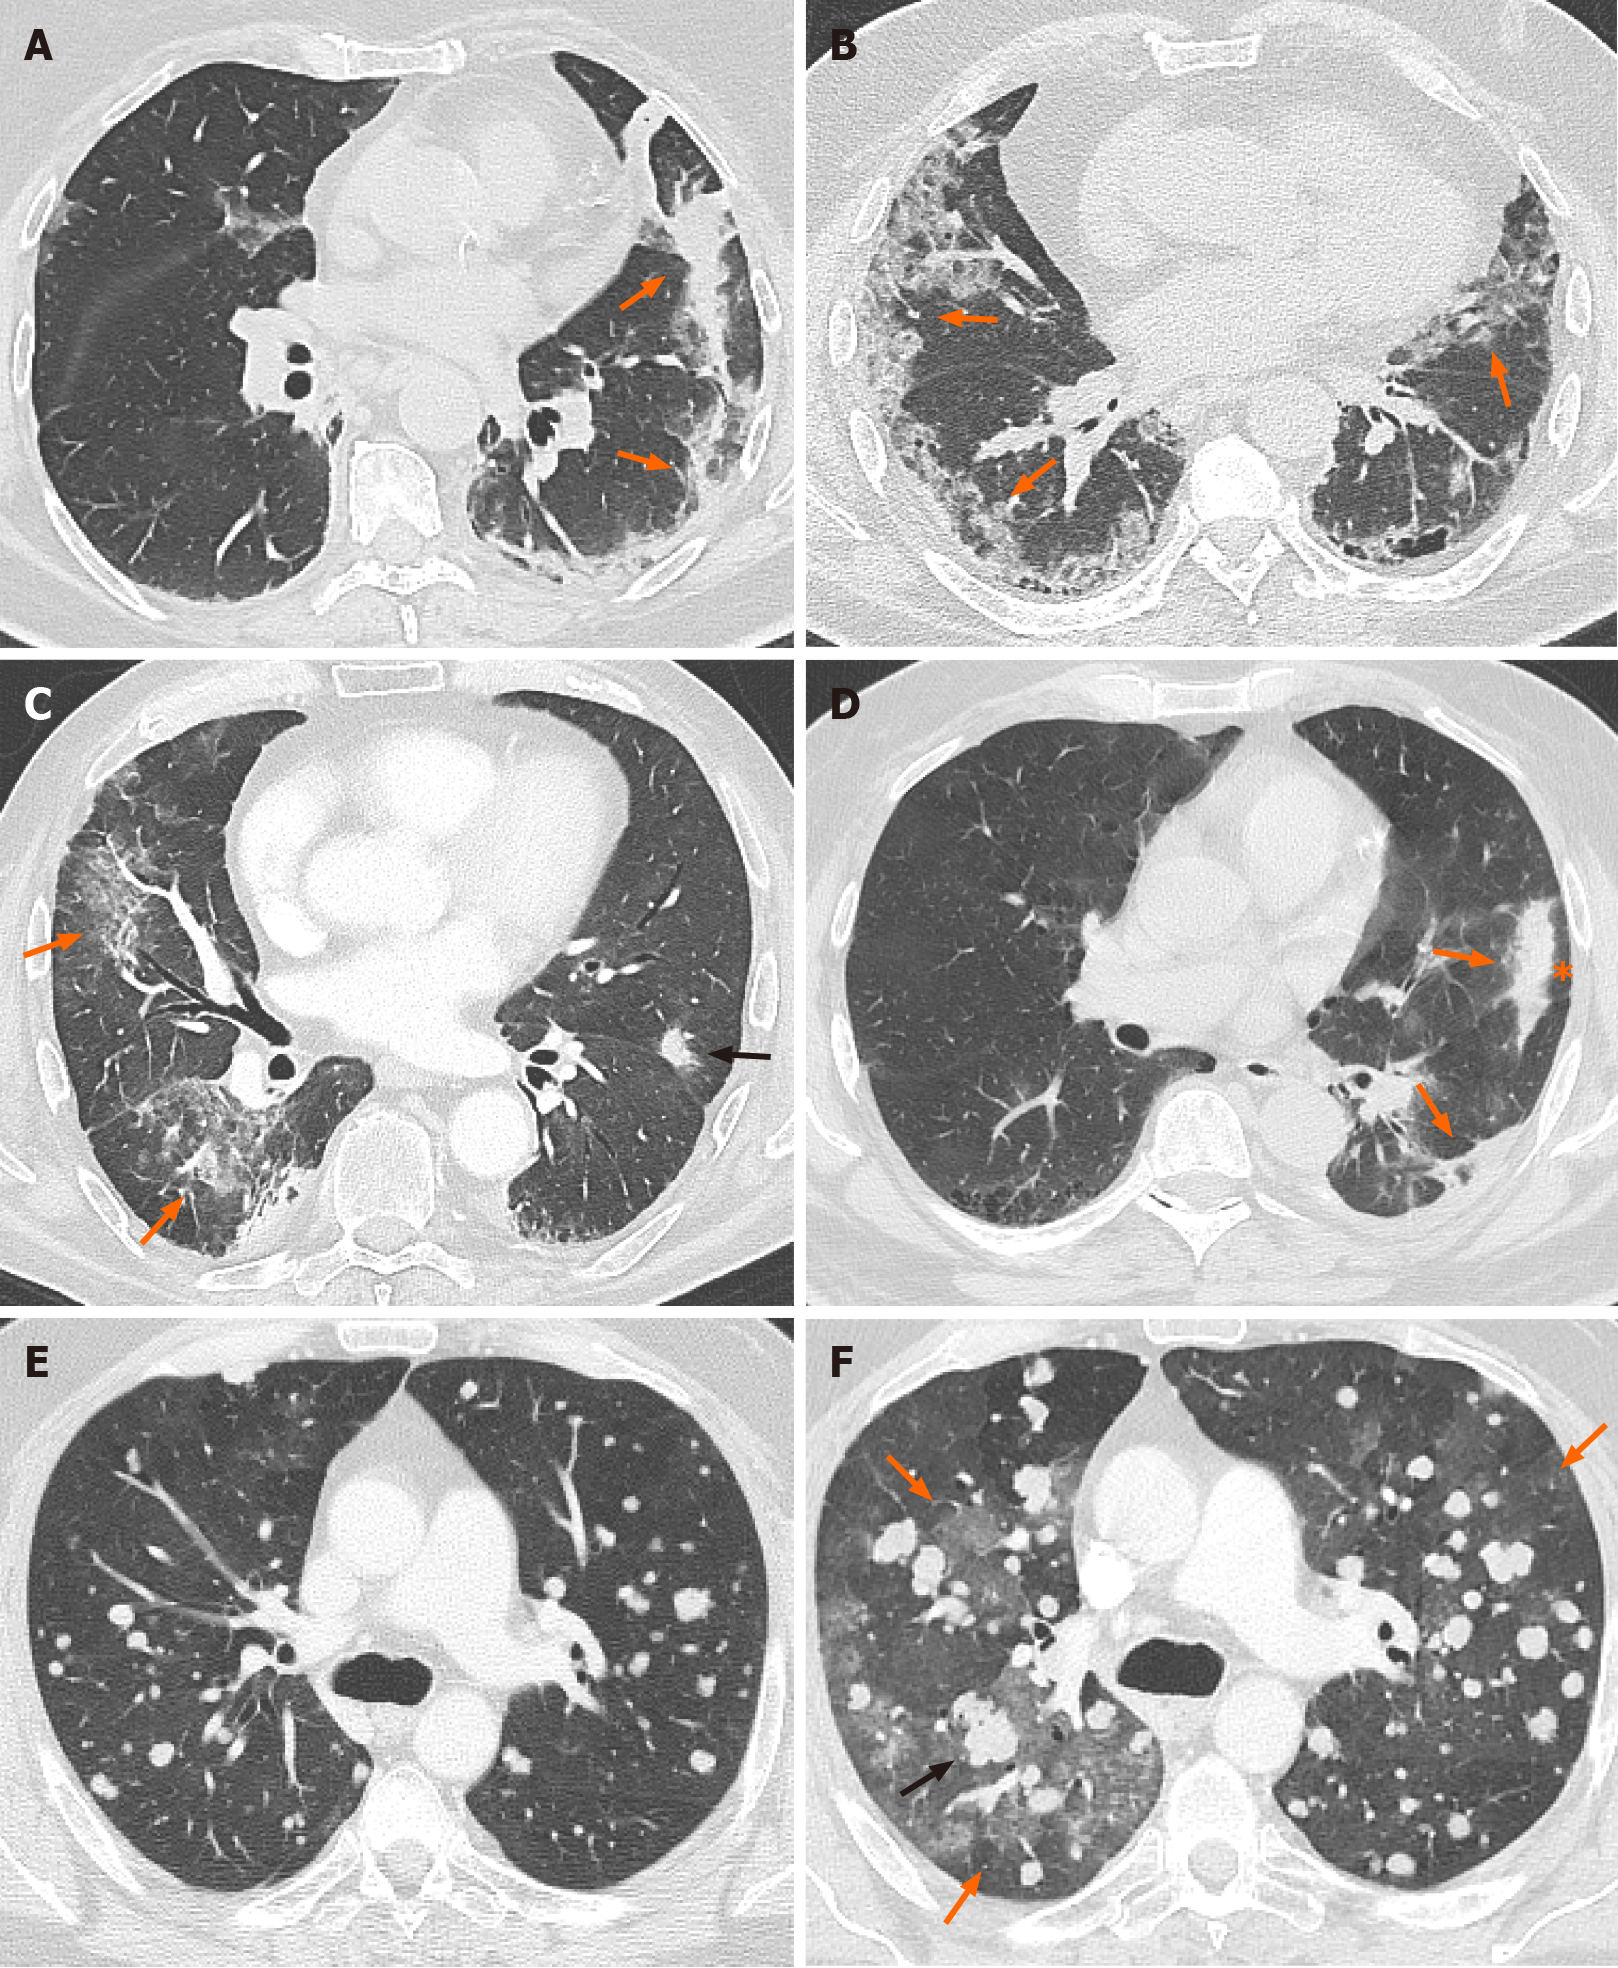
Figure 5 Axial computed tomography image.
A: Axial computed tomography (CT) image of a 45-year-old patient with coronavirus disease 2019 showing left peripheral consolidation with perilobular distribution (arrows) suggesting organizing pneumonia; B: Axial CT image showing bilateral ground-glass opacities distributed in the subpleural regions (arrows) in a renal cancer patient confirmed with coronavirus disease 2019 pneumonia; C: Axial CT image showing multifocal ground-glass opacities in the right lung (orange arrows) and nodular consolidation (black arrow) in a renal cancer patient diagnosed with immune-related pneumonitis after treatment with nivolumab; D: Axial CT image of a patient suffering from immune-related pneumonitis showing multifocal, bandlike consolidation in the left lower lobe (arrows) with peripheral sparing (asterisk) suggesting organizing pneumonia; E and F: The last is a case of immune-related pneumonitis in a patient undergoing ipilimumab plus nivolumab for metastatic soft tissue sarcoma, whose baseline axial CT image (E) shows bilateral solid metastatic nodules; the axial CT image obtained after starting immunotherapy (F) shows new multifocal ground-glass opacities (orange arrows) with interval enlargement and an increasing number of pulmonary nodules (black arrow).
- Citation: Perrone F, Balbi M, Casartelli C, Buti S, Milanese G, Sverzellati N, Bersanelli M. Differential diagnosis of COVID-19 at the chest computed tomography scan: A review with special focus on cancer patients. World J Radiol 2021; 13(8): 243-257
- URL: https://www.wjgnet.com/1949-8470/full/v13/i8/243.htm
- DOI: https://dx.doi.org/10.4329/wjr.v13.i8.243


