Copyright
©The Author(s) 2017.
World J Cardiol. Sep 26, 2017; 9(9): 749-756
Published online Sep 26, 2017. doi: 10.4330/wjc.v9.i9.749
Published online Sep 26, 2017. doi: 10.4330/wjc.v9.i9.749
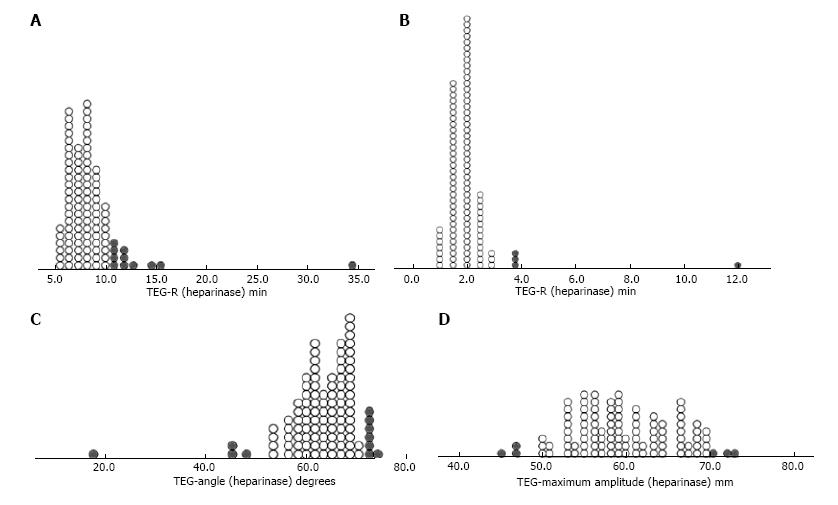
Figure 4 Dot-density plots of thromboelastogram (heparinase) parameters R (panel A), K (panel B), angle (panel C) and maximum amplitude (panel D) showing distribution of individual values.
Abnormal values are represented by solid grey circles. TEG: Thromboelastogram.
- Citation: Bhatia AK, Yabrodi M, Carroll M, Bunting S, Kanter K, Maher KO, Deshpande SR. Utility and correlation of known anticoagulation parameters in the management of pediatric ventricular assist devices. World J Cardiol 2017; 9(9): 749-756
- URL: https://www.wjgnet.com/1949-8462/full/v9/i9/749.htm
- DOI: https://dx.doi.org/10.4330/wjc.v9.i9.749


