Copyright
©The Author(s) 2017.
World J Cardiol. Sep 26, 2017; 9(9): 749-756
Published online Sep 26, 2017. doi: 10.4330/wjc.v9.i9.749
Published online Sep 26, 2017. doi: 10.4330/wjc.v9.i9.749
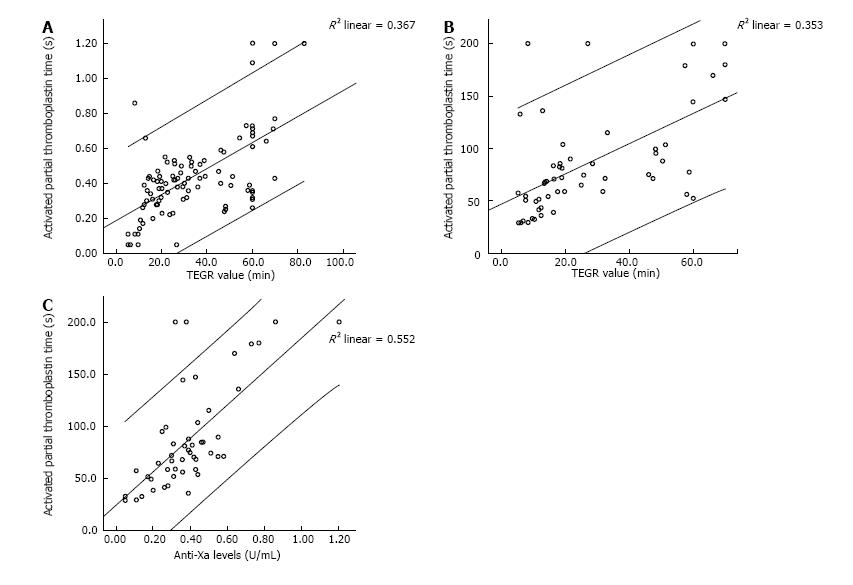
Figure 1 Scatterplots demonstrating correlation between standard measures of anticoagulation for patients on left ventricular assist device support.
The estimated linear regression line (line of best fit) is shown along with 95%CI for individual value predictions for (A) anti-Xa and TEG-R levels, (B) aPTT and TEG-R levels, and (C) aPTT and anti-Xa levels. The R2 values are shown alongside each panel (all P < 0.001). aPTT: Activated thromboplastin time; TEG: Thromboelastogram.
- Citation: Bhatia AK, Yabrodi M, Carroll M, Bunting S, Kanter K, Maher KO, Deshpande SR. Utility and correlation of known anticoagulation parameters in the management of pediatric ventricular assist devices. World J Cardiol 2017; 9(9): 749-756
- URL: https://www.wjgnet.com/1949-8462/full/v9/i9/749.htm
- DOI: https://dx.doi.org/10.4330/wjc.v9.i9.749


