
















©The Author(s) 2017.
World J Cardiol. Apr 26, 2017; 9(4): 363-370
Published online Apr 26, 2017. doi: 10.4330/wjc.v9.i4.363
Published online Apr 26, 2017. doi: 10.4330/wjc.v9.i4.363
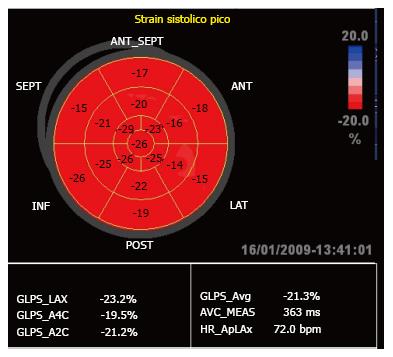
Figure 3 Bull’s eye image of the same normal subject shown in Figure 2, showing percent strain value in the 17 segments analyzed.
Mean value of the peak overall systolic strain is also reported (GLPS_Avg: -21.8%) as well as that of each of the 3 apical views (GLPS_LAX: -20.1%, GLPS_A4C: -23.3% and GLPS_A2C: -22%).
- Citation: Saccheri MC, Cianciulli TF, Morita LA, Méndez RJ, Beck MA, Guerra JE, Cozzarin A, Puente LJ, Balletti LR, Lax JA. Speckle tracking echocardiography to assess regional ventricular function in patients with apical hypertrophic cardiomyopathy. World J Cardiol 2017; 9(4): 363-370
- URL: https://www.wjgnet.com/1949-8462/full/v9/i4/363.htm
- DOI: https://dx.doi.org/10.4330/wjc.v9.i4.363